5 min read
2026 Freight Trends Report
June 1, 2026
Share:
Table of contents
Browse the table of contents to jump straight to the part you’re looking for
Executive Summary
While economic signals remain mixed from 2025 going into 2026, the freight market presents a unique window of opportunity for strategic leaders. The "wait-and-see" approach of 2025 is evolving into a landscape focused on long-term strategy. Although economic uncertainty continues to dampen immediate freight demand, new regulatory pressures, evolving trade policies, and other market dynamics are beginning to tighten capacity, raising questions of a potential market turn in mid-to-late 2026.
This report provides a comprehensive analysis of the freight market landscape for 2026. It examines the converging forces of regulatory enforcement, macroeconomic shifts, and trade policy that are reshaping supply chain dynamics. By analyzing proprietary data and broader industry trends, this report aims to equip Directors, VPs, and C-Suite executives with the intelligence needed to optimize transportation networks, reduce costs, and achieve sustainability goals in a dynamic market.
Key Takeaways
- Regulatory changes are contributing to near-term capacity tightening, with implications for driver availability and costs on the supply-side of freight markets.
- Economic uncertainty and soft demand are likely to persist into 2026, delaying any potential market turn until mid-to-late 2026 when demand recovery and supply-side pressures align.
- Tariff uncertainty in 2025 drove early import front-loading and later slowdowns. Assuming tariff policy shocks are limited in 2026, import patterns are expected to normalize.
- The rise of AI-powered logistics technologies is advancing how shippers optimize costs and secure capacity through real-time data and strategic insights.
- Strategic preparation during this soft market will position stakeholders to capitalize on rate volatility and capacity constraints when the market rebounds.
Methodology
The insights presented in this report come from Breakthrough’s ecosystem of transportation data, capturing real-time shipper transactions and freight market dynamics. This analysis is supplemented by data from the Federal Motor Carrier Safety Administration (FMCSA), ADP, Datamyne, and broader economic indicators to provide a holistic view of the 2026 outlook.
About the Breakthrough Ecosystem
The Breakthrough Ecosystem is one of the cleanest and most robust sets of transportation data in the U.S.
- 46.5+ million shipments
- $35+ billion in transportation spend
- 16.5 billion commercial transportation miles
Part 1: Market Overview
The uncertainty in 2025 led to a “wait-and-see” approach by shippers and carriers that flattened demand and largely prolonged the low rates of the freight recession. The freight market in 2026 masks a fundamental imbalance: the significant oversupply of capacity from the pandemic era clashing with new constraints beginning to reverse this trend. While demand remains soft, this supply-side pressure is setting the stage for future tightening.
Key drivers behind this tightening are emerging on a couple fronts:
- New regulatory policies are creating headwinds for driver availability.
- Persistent cost pressures are contributing to carrier exits, causing a gradual erosion of excess capacity, which has long suppressed rates.
For shippers, this dynamic creates a strategic challenge. This period of soft demand and stable rates will likely lead to heightened volatility once demand returns and collides with a smaller capacity base.
A significant market turn remains unlikely in the near term, as it requires the dual catalysts of a demand recovery and the full impact of these supply-side pressures to materialize. However, if the broader macroeconomic environment strengthens demand dynamics later in 2026, a market turn is not out of the question.
Part 2: Key Policies and Regulations You Need to Know
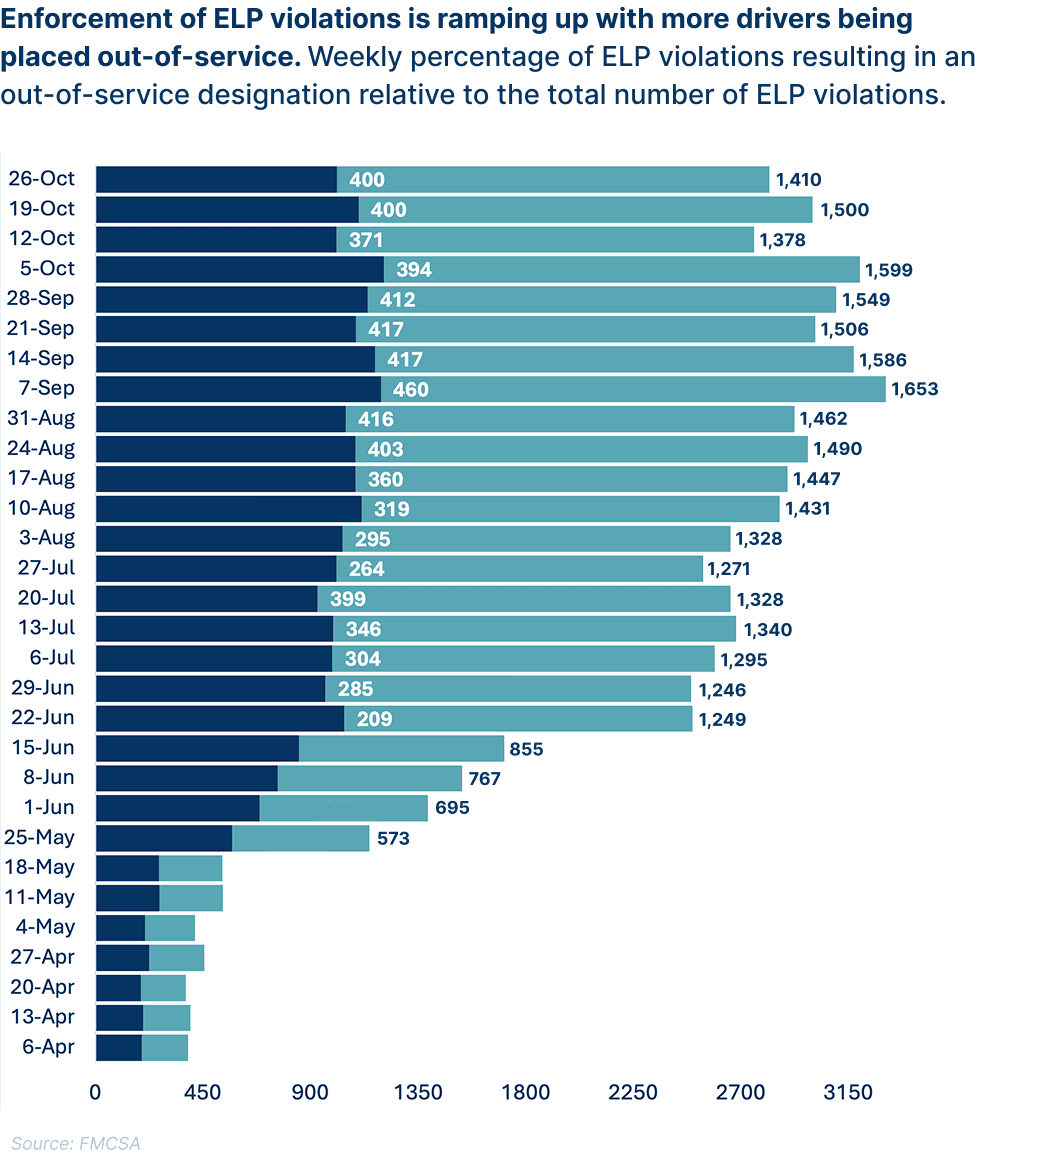
English Language Proficiency (ELP) EnforcementA pivotal shift began in April 2025 with an Executive Order mandating stricter enforcement of English Language Proficiency (ELP) standards. In response, the CVSA updated its guidelines, making ELP violations an out-of-service (OOS) offense on June 25, 2025. ELP violations continue to increase as more drivers are placed out-of-service. Impact Analysis: From late June through November, FMCSA data revealed a weekly average of approximately:
Geographically, the impact is concentrated, with about two-thirds of all violations occurring in Texas near the U.S.-Mexico border. However, FMCSA guidance prohibits placing drivers out of service for ELP violations within designated Commercial Border Zones, moderating the immediate impact on cross-border flows. |
 |
Non-Domiciled CDL Emergency Rule
While ELP enforcement creates friction, a late September 2025 emergency rule on non-domiciled CDLs presents a more substantial threat. This rule narrows visa eligibility strictly to H-2A, H-2B, and E-2 holders, excluding groups such as asylum seekers and DACA recipients. Furthermore, it mandates in-person-only renewals, increasing administrative friction.
Impact Analysis: The Transportation Secretary estimated that roughly 200,000 drivers could be affected. This policy could accelerate carrier exits in 2026 and create acute regional labor shortages, particularly in border states and at major ports.
Heavy-Duty Vehicles and Parts Tariff
Tariffs on heavy-duty trucks and components are expected to add some cost pressures on carriers, further straining their financial margins. These rising equipment and parts costs could complicate the already delayed equipment replacement cycle, making it harder for carriers to maintain their fleets. In addition, higher upfront costs may strain smaller or mid-sized carriers more than larger carriers, which could add competitive and operational challenges to the market.
Impact Analysis: As of November 1, 2025, the U.S. has imposed a 25% tariff on imported heavy-duty trucks and key parts. Vehicles and parts originating under USMCA rules are not fully exempt but face reduced tariffs, with these new tariffs only applicable to non-North American components. These changes are likely to increase costs impacting maintenance and fleet upgrades. Carriers that understand and optimize equipment sourcing will be better positioned to manage these pressures.
EPA 2027 Low NOx Rule
The Environmental Protection Agency (EPA) is maintaining its commitment to the 2027 Low NOx rule, which mandates an 80% reduction in nitrogen oxide (NOx) tailpipe emissions and a 50% reduction in particulate matter emissions. Additionally, the rule significantly increases requirements for vehicle durability by extending original equipment manufacturers’ (OEMs) warranty coverage from 100,000 miles to 450,000 miles and raising the useful life limits for heavy-duty vehicles from 435,000 miles to 650,000 miles. The EPA has also indicated “major changes” to the Low NOx rule could be coming, with a proposed revision expected in spring 2026, set to take effect for Model Year 2028.
Impact Analysis: Many stakeholders contend that the Low NOx rule will create additional costs in the new and used equipment markets, which are already facing significant cost challenges, such as tariffs. Shippers and fleet operators are responding to this period of uncertainty by delaying the purchase of new equipment, awaiting clarity on the cost and regulatory landscape.
Proposed UP-NS Rail Merger
The proposed $71.5 billion merger between Union Pacific (UP) and Norfolk Southern (NS) represents a potential paradigm shift. Announced in July, with the official application filed in December 2025, this massive consolidation is undergoing a rigorous review by the Surface Transportation Board (STB), which is expected to take at least a year.
Impact Analysis:
If approved, the UP-NS merger would create the first truly transcontinental railroad, potentially reducing Midwest interchange bottlenecks and adding network efficiency. However, critics of the merger argue this could also create a less competitive landscape, likely resulting in upward price pressure on linehaul rates and a potential decline in service quality and responsiveness.
For supply chain leaders, understanding these regulatory shifts is crucial. Proactive planning and leveraging predictive insights from a trusted market expert like Breakthrough will be key to navigating the evolving compliance landscape and effectively mitigating cost impacts.
Part 3: Macroeconomic & Trade Dynamics
The health of the supply chain is inextricably linked to broader macroeconomic factors such as consumer confidence, labor market conditions, inflation, and interest rates. For supply chain leaders, staying attuned to these dynamics is essential to ensure resilience, cost efficiency, and adaptability in an ever-changing economic environment.
Consumer and Business Confidence
Despite a reported 4.3% economic growth rate in Q3 2025, consumer confidence is hovering near historic lows, characterized by a "K-shaped" consumer spending trend where high-income households sustain spending while lower-income consumers pull back. This discrepancy highlights the uneven nature of the recovery. Business spending remains muted across most sectors, with one notable exception: AI-related investments. Companies are prioritizing technology that drives efficiency, even as they pause capital expenditure elsewhere.
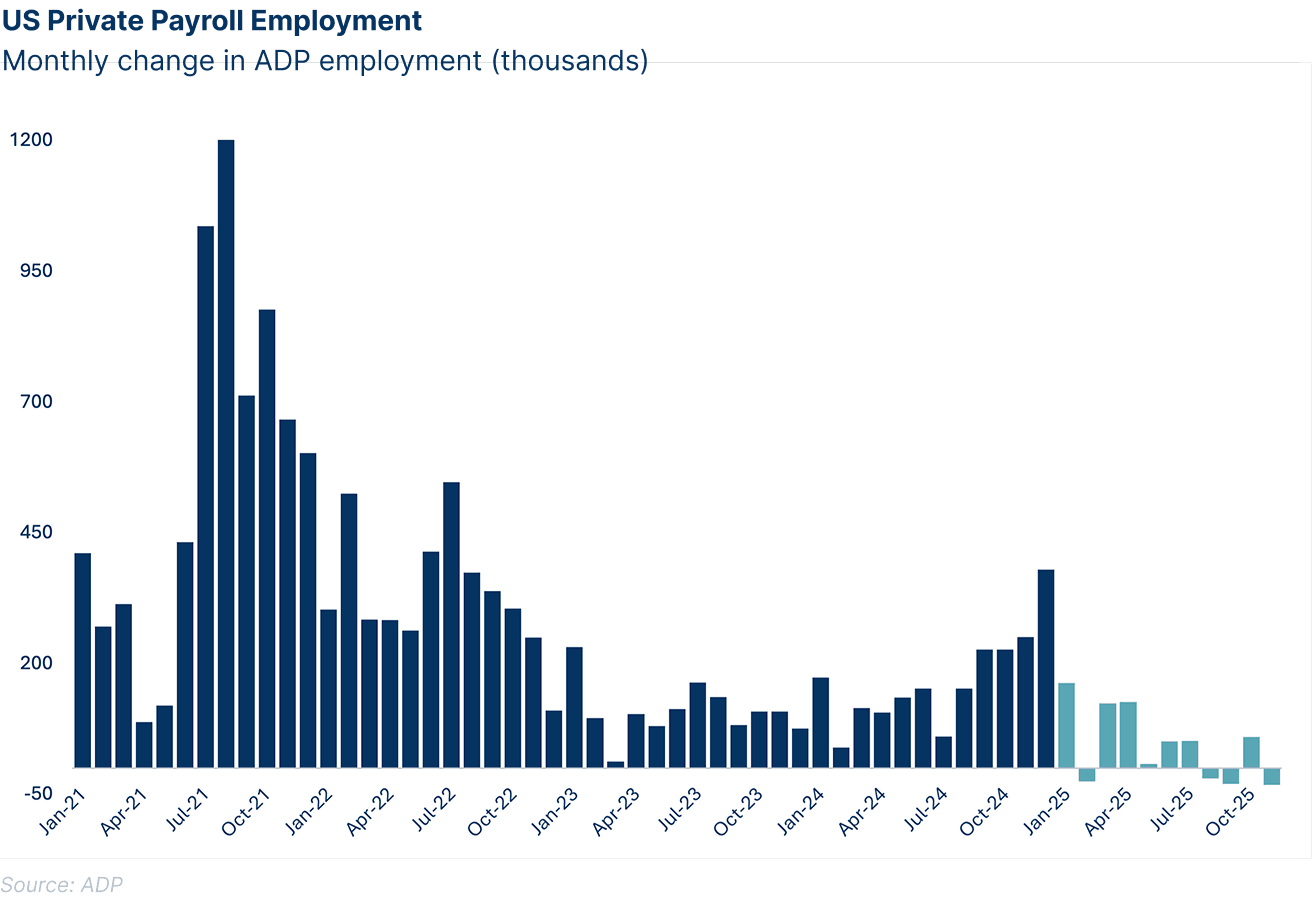
Labor Market ChallengesThe labor market has shifted into a period of notable softness, drawing increased attention from Federal Reserve policymakers. Recent ADP payroll data indicates a troubling trend, with job growth declining in three out of the past four months. November's figures revealed the steepest drop in net job gains for 2025, raising concerns about the broader implications for economic stability. Meanwhile, affordability continues to challenge households following the post-pandemic surge in prices. |
 |
Interest Rates and Inflation Outlook
Inflation remains a persistent challenge, stubbornly positioned near 3%, exceeding the Federal Reserve's 2% target. Despite this, the Fed appears to be prioritizing the stabilization of the labor market over immediate action on inflation, as indicated by the small interest rate cuts in the latter half of 2025. Expect policymakers to hold rates steady until clearer signals emerge on these dual mandate objectives.
Top 10 Critical Issues in the Trucking Industry - 2025
- Economy
- Lawsuit abuse reform
- Insurance cost/availability
- Truck parking
- Driver compensation
- CSA
- English language proficiency for drivers
- Diesel emissions regulations
- Driver training standards
- AI in trucking
Source: ATRI’s 2025 Top Industry Issues (TII) report
Tariffs & Trade
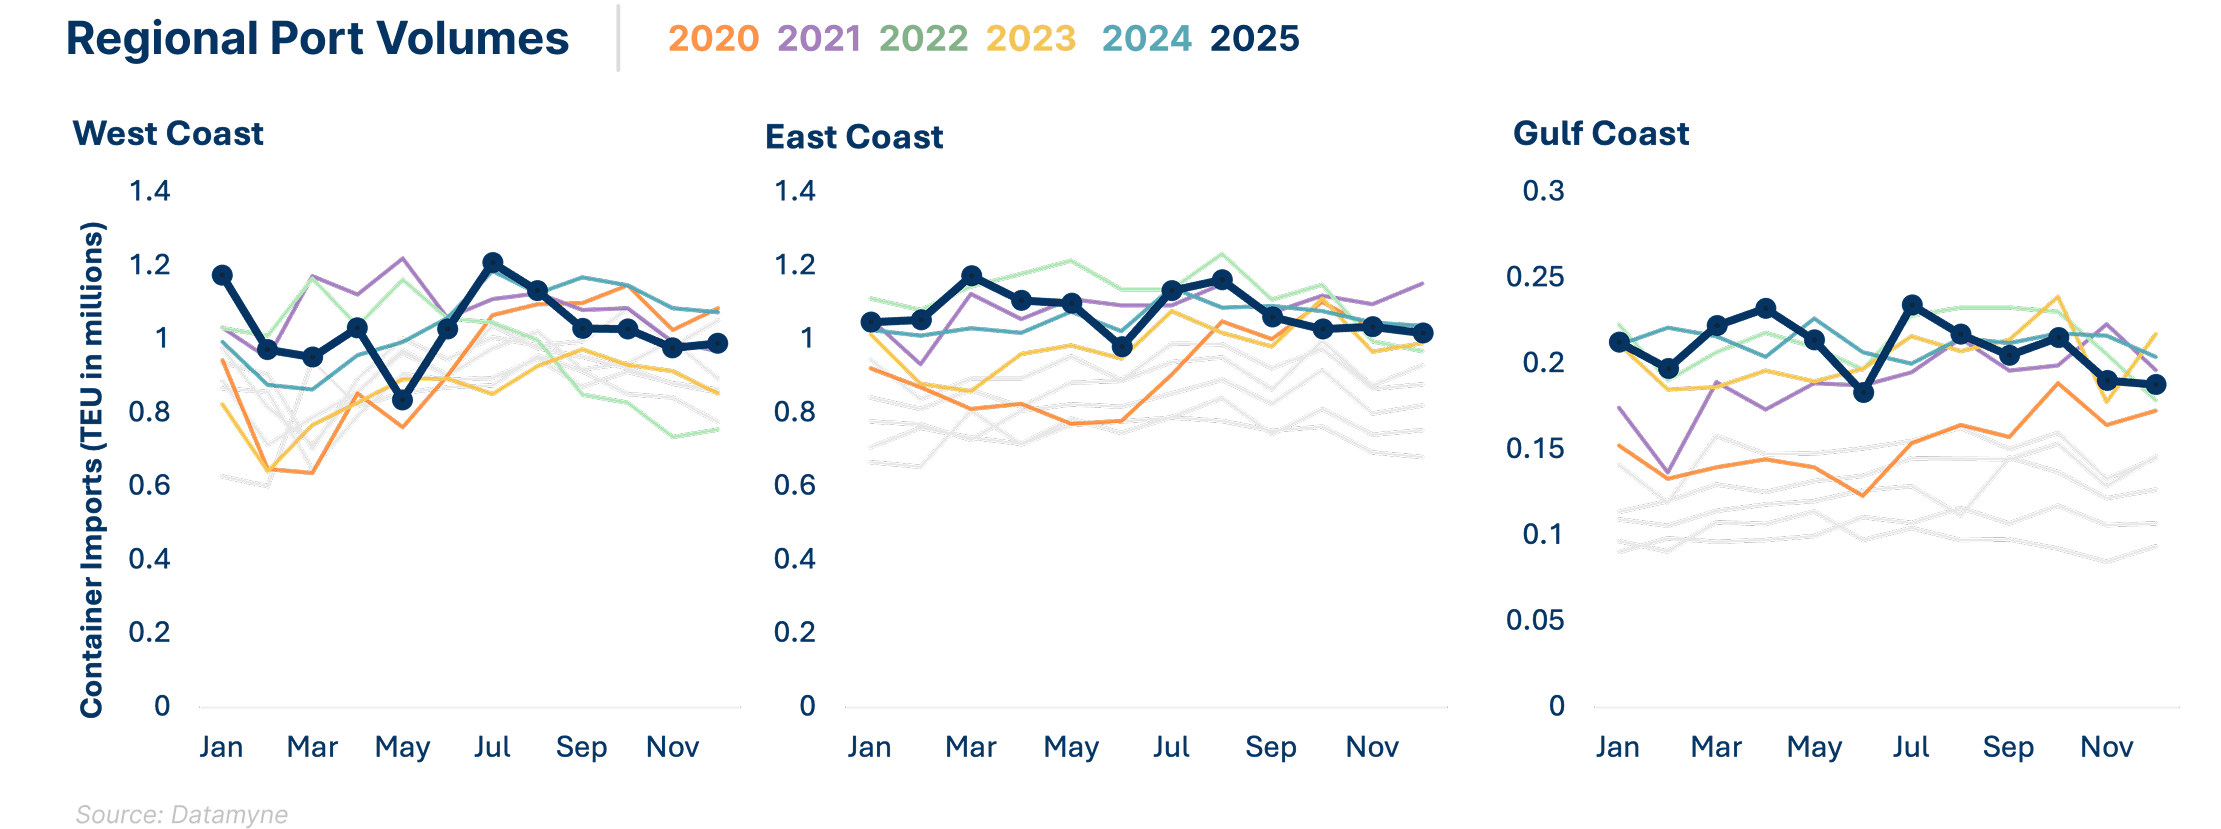
In 2025, tariff uncertainty drove importers to front-load shipments, boosting port and intermodal volumes early in the year, but later causing slowdowns. While tariffs on steel, aluminum, and heavy-duty trucks directly affect costs, it was mostly policy uncertainty that disrupted freight flows, reshaping trade patterns and creating volatility. While a pending Supreme Court ruling on IEEPA tariffs continues to inject uncertainty, Section 232 and Section 301 tariffs appear likely to remain in place, offering some stability that could help import behavior normalize to typical patterns throughout 2026.
Stay Informed of Tariff Updates
Breakthrough's Tariff Tracker offers insights into current tariff rates and their implications for your supply chain. Gain the clarity you need to make informed decisions and mitigate costs effectively.

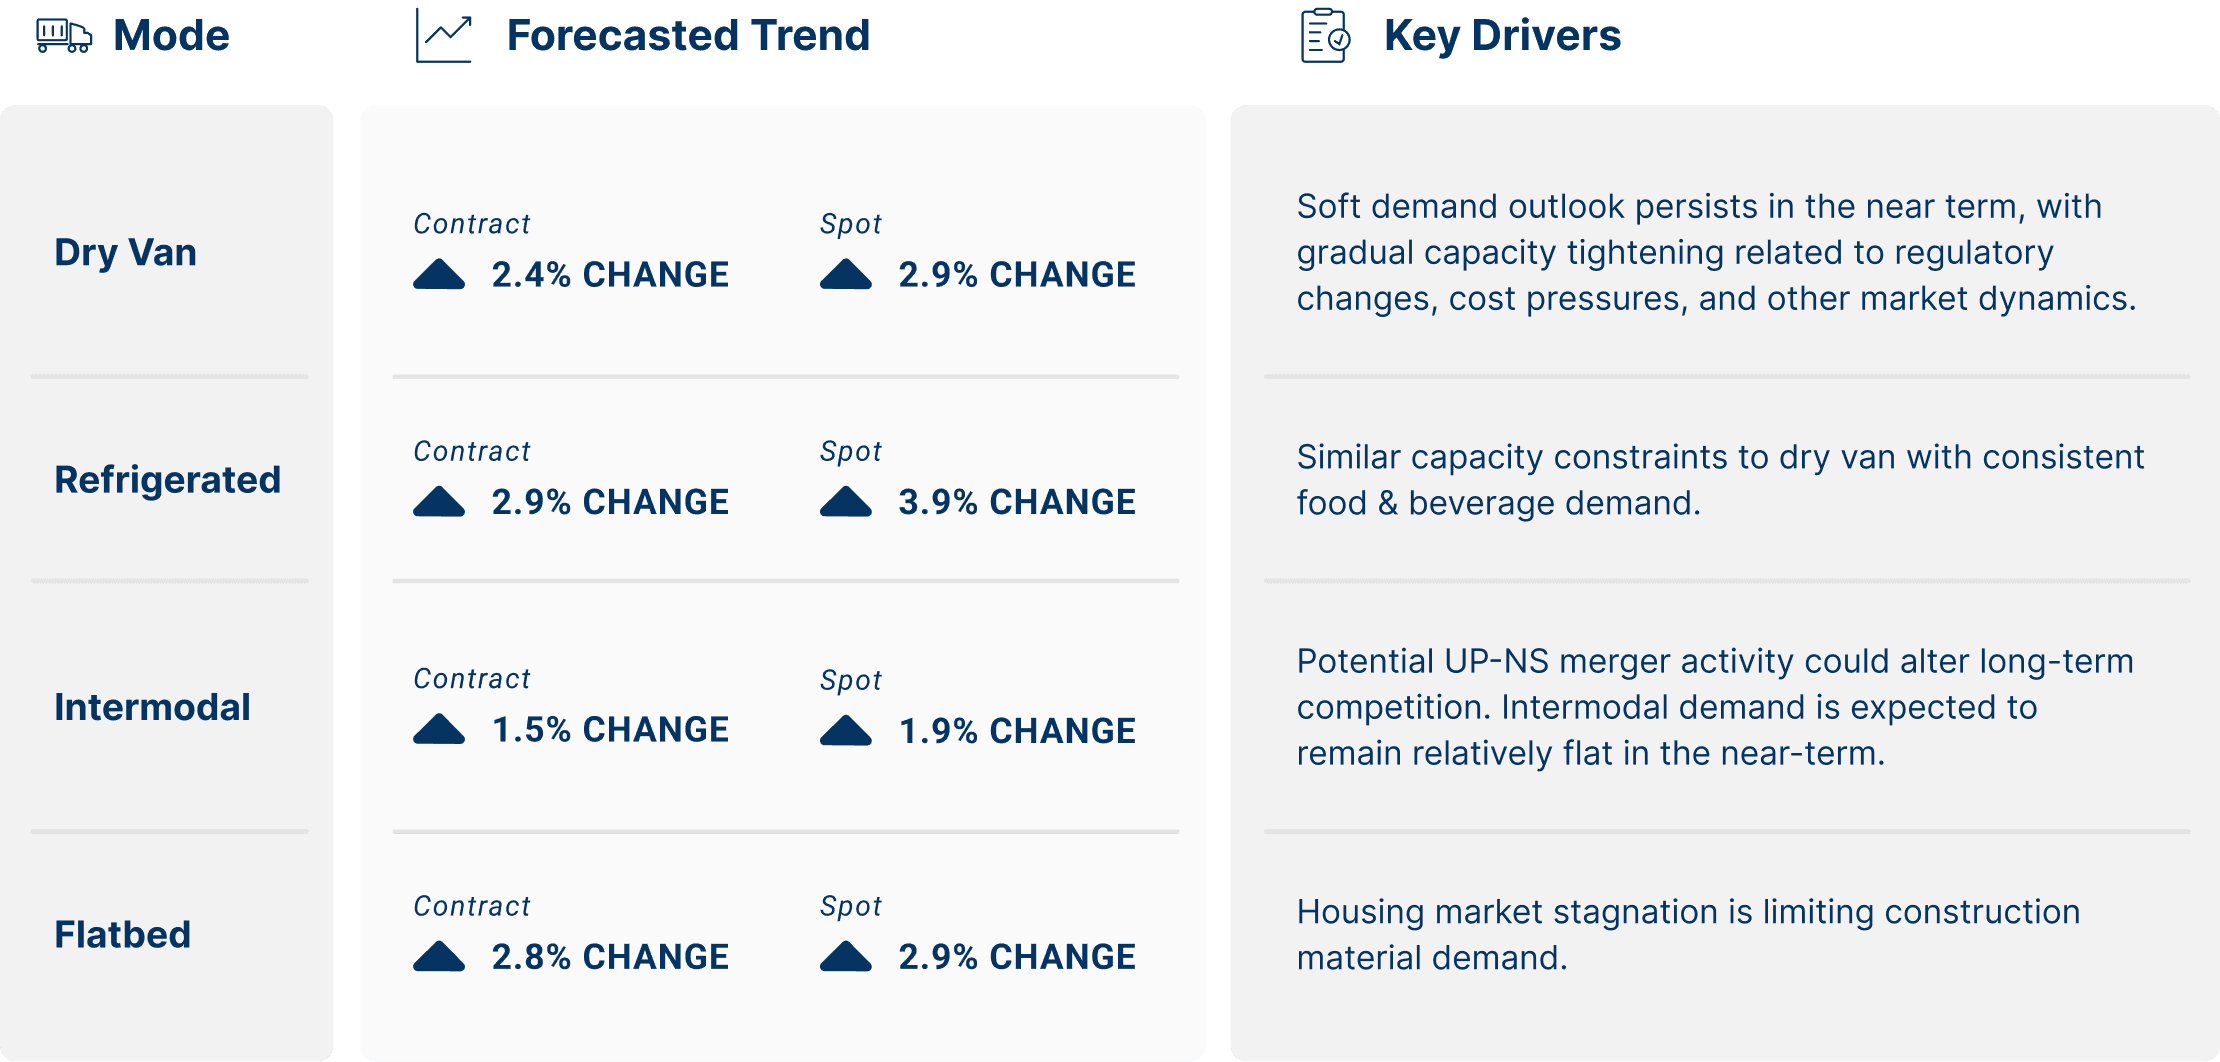
Part 4: Modal Trends & Rate Forecasts
Our rate outlook is based on the premise that freight demand continues to be muted in the near term while capacity gradually tightens throughout 2026. The Breakthrough Freight Demand Indicator is expected to grow by 0.5% over the next 12-month, while freight rates are forecasted to modestly increase. This increase is driven primarily by supply-side constraints rather than a robust demand recovery.
Discover How Capac-ID Can Add Value to Your Transportation Network
Market rates shift every day, making traditional benchmarking lag reality. Shippers require real-time tools to navigate 2026 effectively. Capac-ID provides an innovative approach to source best-fit carriers and benchmark linehaul rates against the industry on each lane.
Unlike static benchmarks, Capac-ID offers:
- Real-Time Linehaul Rate Visibility: See how shipper-transacted linehaul rates are moving each day, not last month.
- Capacity Sourcing: Identify best-fit carriers based on a complete carrier profile, ensuring partners meet specific service and ownership criteria.
- Network Optimization: Use data-driven insights to challenge incumbents and validate proposed rate increases against actual market movements.
For executives focused on cost reduction and network optimization, integrating tools like Capac-ID turns procurement into a proactive strategic advantage.
Turn Challenges into Opportunities in 2026
The 2026 freight market will be defined by the intersection of policy and economics. While immediate demand remains soft, the supply side is undergoing some structural changes that will likely pressure rates to increase. Industry-leading shippers are embracing AI-powered logistics technologies to uncover opportunities to optimize their routing guide, address deviations from their RFP, and benchmark their linehaul rates against the industry by lane to protect their bottom line.
Ready to build a resilient, sustainable transportation network?
Request a demo to discover the hidden opportunities to optimize your transportation operations for peak efficiency, sustainability, and reliability — and set the standard in your industry.

Download the report
Take the full 2026 Freight Trends Report with you. Download your copy to save these insights for future reference or to share them with your team.
