5 min read
2025 Freight Trends Report
December 1, 2025
Share:
Table of contents
Browse the table of contents to jump straight to the part you’re looking for
2024 experienced a continuation of the 2023 soft freight market. With freight volumes lower and capacity abundant for this extended period of time, it allowed shippers to lower their costs and establish deeper relationships with their core carriers. Learn what shippers can expect for the 2025 freight market.
Executive Summary
As we approach the freight market in 2025, it's critical for shippers to adopt a more forward-thinking strategy that focuses on resilience and proactive planning. Demand for freight, or the volume of shipments in the market, is expected to increase as monetary policy becomes more accommodating, business confidence improves, and consumer spending remains resilient.
Shippers need to stay agile and well-informed to adapt their strategies and optimize supply chains effectively. While uncertainties are inevitable, it’s crucial for shippers to prepare for the challenges ahead. Trade tariffs, evolving labor relations, and regional sustainability initiatives could disrupt capacity and increase operational costs.
In this complex and evolving environment, working with a trusted transportation advisor is essential. By closely monitoring economic and policy developments, shippers can make informed decisions, mitigate risks, and capitalize on opportunities to maintain a competitive edge in 2025.
Key Takeaways
- Monitor economic indicators: Track consumer confidence, inflation, and interest rates to anticipate shifts in freight demand.
- Adapt to regulatory changes: Stay informed about evolving trade, labor, and sustainability regulations to safeguard your supply chain.
- Strengthen relationships with asset-based carriers: Secure long-term contracts to protect against spot market volatility and brokerage rate fluctuations.
- Leverage technology for disruptions: Use AI and data-driven tools to improve decision-making and respond quickly to supply chain disruptions.
Explore the 2026 Freight Trends Report
Check out the 2026 Freight Trends Report for the most up-to-date trends and insights.

Key Economic Indicators to Watch
Understanding key economic indicators and what drives consumer behavior is essential for shippers navigating today’s dynamic freight market. Staying informed about trends such as consumer confidence, spending patterns and interest rates allow shippers to adapt their supply chain strategies, collaborate effectively with carriers, and position themselves competitively to capitalize on evolving economic conditions.
Consumer Confidence
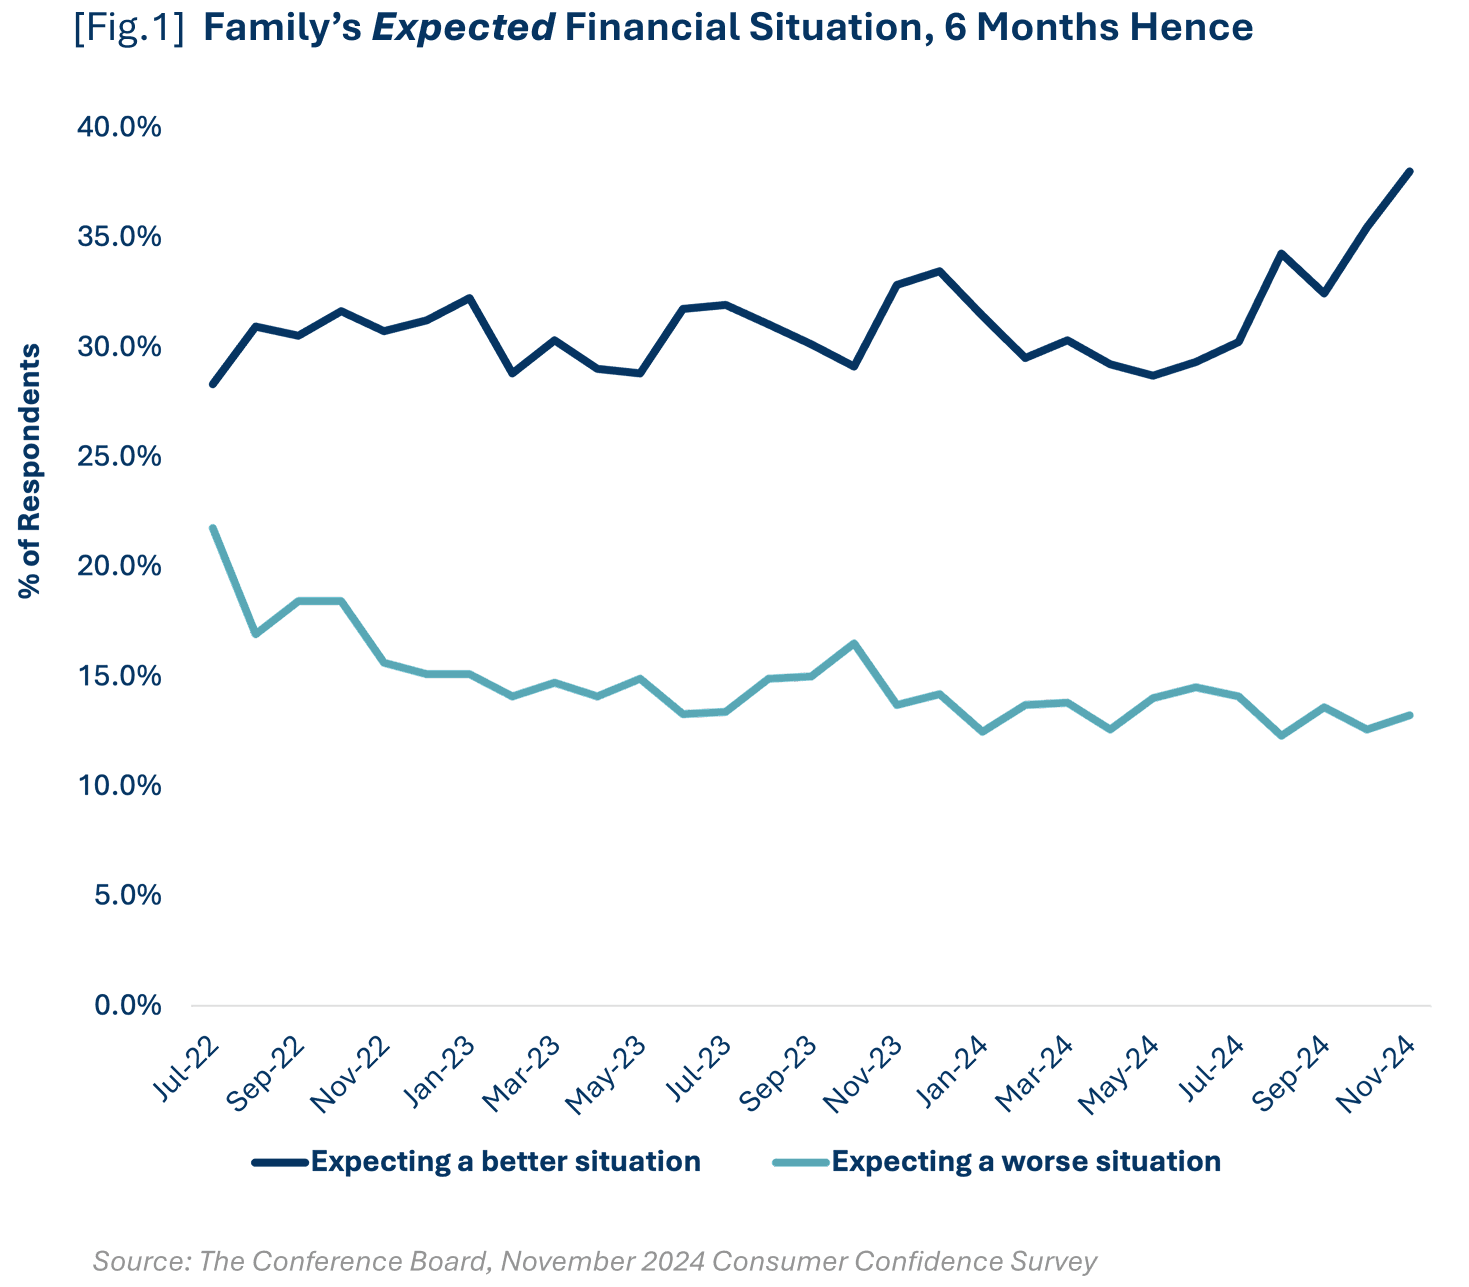
The Consumer Confidence Survey from The Conference Board, which reflects prevailing business conditions and likely developments for the months ahead, posted its highest monthly value since mid-2023 in November, which is a rise of 8.4 points from September. This was the largest 2-month gain since early 2021. The survey also showed a growing number of families are expecting a better financial situation in the next six months [Fig.1]. The consumer confidence reading became reality in economic performance indicators such as retail sales.
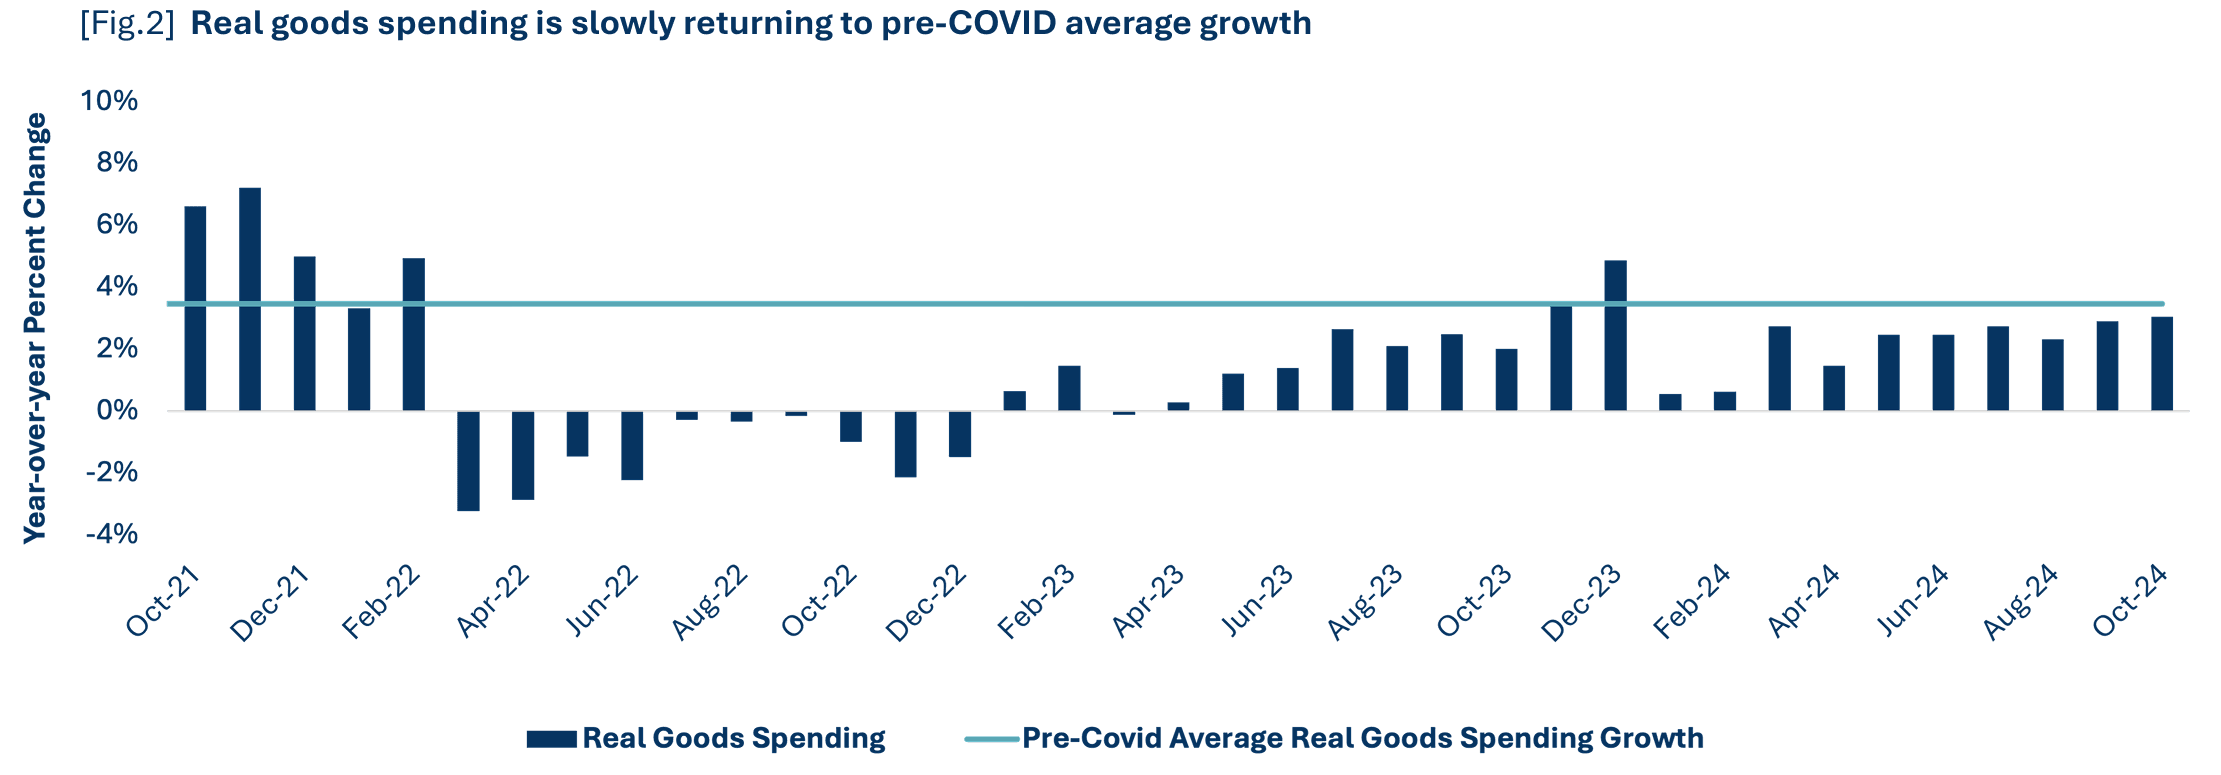
Consumer Spending
Consumers sustained their spending growth in the latter half of 2024 and are expected to demonstrate continued resilience in 2025. Retail sales increased 0.9% from October to November and increased 4.1% on an annual basis. Additionally, year-over-year growth in real personal consumption expenditures (another data set to highlight consumer spending) on goods increased every month in 2024 and is expected to continue to grow.
Consumers remained willing to spend their discretionary dollars on dining out, too – in a positive sign for consumer confidence and spending. October and November sales at restaurants and bars increased, outpacing higher prices in the sales totals. Bar and restaurant sales were 1.9% and 4.2% higher for October and November, on a year-over-year basis.
As consumers feel better about their finances and spend more, especially on goods, more freight is created, and the market will tighten. This is expected to be one of the largest influencers of freight activity in 2025.
Interest Rates & Inflation
Moderating inflation and signs of labor market weakness continue to suggest rate cuts from the Federal Reserve. The Federal Reserve cut interest rates by 25 basis points in December 2024, but future rate decisions will become more uncertain, particularly should elements of fiscal policy renew inflationary pressure. Additionally, The Bureau of Economic Analysis (BEA) published in October that inflation-adjusted disposable income increased more than 3% during each month of 2024, rather than by between 1-2% like earlier releases the data suggested. This places the disposable income growth trend closer to pre-pandemic norms and supports purchasing power for consumers.
Inflation is impactful to the freight market because it decreases the purchasing power of consumers. When consumers buy less because of higher prices or decide not to make a purchase because of the expectation of a tighter budget in the future, it provides downside risk to freight demand. U.S. monetary policy tightened to slow the rate of inflation and improve price stability. The U.S. inflation rate is gradually decreasing, moving closer to long-term policy expectations set by the U.S. Federal Reserve. If market conditions continue to allow for the loosening of monetary policy, it will support more robust consumer spending and could provide growth in domestic manufacturing and industrial production, which drive freight demand.
Shippers should monitor inflation, interest rate changes, and consumer spending, as these heavily influence freight demand. With stronger consumer financial health expected to boost freight volumes, shippers must adapt to changing conditions, collaborate with carriers, and optimize supply chain strategies to seize opportunities and stay competitive.
Policy Shifts Shaping the 2025 Freight Market
Keeping a close eye on policy changes is crucial as they directly impact freight markets, operational strategies, and overall supply chain resilience. Several key factors tied to government policies, trade relations, and labor dynamics will play a significant role in shaping the 2025 freight market. Understanding these developments can help shippers proactively manage risks and capture opportunities.
Trade
Trade policy, particularly tariffs, will remain a focal point in 2025. Economists largely agree that increased tariffs could elevate inflation by driving up consumer prices. While there’s speculation that negotiations may replace the drastic tariff increases currently proposed, the possibility of significant hikes – such as a 60% tariff on Chinese imports under consideration – cannot be ignored. Projections from Morgan Stanley suggest these tariffs could raise U.S. consumer prices by 0.9% while Goldman Sachs estimates a smaller impact of 20 percentage points. These potential changes place added pressure to adapt sourcing strategies, either by sourcing from different countries or increasing domestic production to mitigate cost impacts.
Taxes
Tax policy is another critical area of influence. Portions of the 2017 tax reform, including reduced rates for businesses and individuals, are set to expire at the end of 2025. Although this policy is already baked into current strategies, its extension or cessation could shape longer-term freight demand and investment decisions. With a divided Congress—Republicans narrowly holding the House and retaking the Senate—there is a stronger likelihood of alignment with the administration’s proposed agenda, including modifications to tax regulations and trade policies.
Labor
Labor also plays a defining role in freight dynamics, as highlighted by the recent East and Gulf Coast port strikes. The tentative agreements have provided temporary relief, with resolved disputes on wages extending contracts until January 2025. However, automation continues to be a contentious issue that could resurface, creating renewed uncertainty. For now, operational disruptions remain limited, with proactive measures like front-loading reducing vessel backlogs. Should future strikes coincide with critical periods, such as peak shipping seasons, greater impacts on freight movement may emerge.
Sustainability
West Coast carbon programs are gaining momentum, even in the face of past federal opposition from the Trump administration and a Republican-controlled Congress. These initiatives not only highlight the leadership role of these states but also present both challenges and opportunities for industries navigating the transition to a low-carbon future.
Washington State | The cap-and-trade system, put to a vote on the November 5th ballot, successfully withstood repeal efforts. This means the program will continue to influence diesel prices. | |||
| Washington is in the final stages of linking its system with California and Quebec, a move expected to alleviate some of the fuel cost impacts by creating a more integrated market. | ||||
Oregon | Oregon will reinstate its Climate Protection Program in early 2025 that mandates a 50% reduction in greenhouse gas (GHG) emissions by 2035 and a 90% reduction by 2050. | |||
| Fuel suppliers of diesel, natural gas, and other refined products will be regulated. However, biomass-derived fuels, like biodiesel, are exempt. | ||||
California | California took proactive measures following President Trump’s election, calling a special legislative session to safeguard the state’s ambitious climate and clean energy initiatives, like the Advanced Clean Trucks, Advanced Clean Fleets, and In-Use Locomotive rules, which could face challenges at the federal level and through litigation. | |||
| California revamped its Low Carbon Fuel Standard (LCFS) program, introducing stricter carbon intensity targets that will create challenges for fossil fuel producers while increasing opportunities for alternative fuels. | ||||
As the West Coast continues to lead on climate action, these evolving cap-and-trade programs and clean fuel standard regulatory frameworks signal both challenges and opportunities for industries transitioning to a low-carbon future.
Navigating these evolving conditions requires shippers to stay informed about critical economic indicators, from trade tariffs to labor relations. By closely monitoring policy shifts and their associated risks, shippers can adapt sourcing strategies, align with shifting supply chain demands, and build resilience. This awareness will be instrumental in maintaining a competitive edge in 2025’s complex and dynamic freight landscape.
Policy & Regulatory Outlook
Below is a timeline of policies, regulations, and events in the United States that may be impactful to transportation networks.
- Q4 2024: Washington State cap-and-trade repeal on the ballot (rejected)
- Q4 2024 - Q1 2025: California LCSF updates
- Q1 2025: Oregon to reinstate cap-and-trade program
- Q1 2025: New York cap-and-trade system expected
- Q1 2026: California Climate Accountability Act – Scopes 1&2
- Q1 2027: California Climate Accountability Act – Scope 3
Strategies to Combat Cargo Theft
Cargo theft and fraud remain a pressing concern for shippers, and their impact shows no signs of slowing down. Throughout 2024, these issues were at the forefront of industry discussions, with theft and fraud consistently on the rise. Looking ahead to 2025, shippers are expected to continue grappling with these critical challenges, making it more important than ever to implement strategies that address and mitigate these growing risks.
In 2024, TIA members, or the Transportation Intermediaries Association, reported gross fraud cost on average approximately $402,340 per company, with each load costing about $40,760. The food and beverage industry, along with household goods, ranks among the most targeted sectors, incurring global losses estimated between $30-50 billion annually. This figure may rise even further when accounting for undetected scams. To effectively tackle the anticipated threats in 2025, shippers must strategically focus on building resilient and transparent supply networks. Here's how:
Elevate your vetting process
Strengthen your vetting process by conducting thorough background checks on the trucking companies you partner with. Verify their reputation, financial stability, and operational history, and review drivers' backgrounds for any potential security risks. Additionally, consider adopting an asset-based carrier identification solution that features only trusted carriers.
Cultivate meaningful relationships with carriers
Develop strong, open communication channels with carriers to enhance transparency and detect potential threats to your freight. Secure documentation early in the process.
Audit and monitor performance
Regular audits and continuous monitoring of trucking companies’ performance, especially their adherence to cargo security standards, can help ensure they meet required safety protocols. This ongoing oversight is crucial for preventing lapses in security and ensuring timely, secure deliveries.
Ensure compliance and certifications
Make sure your trucking partners comply with relevant security certifications, such as C-TPAT (Customs-Trade Partnership Against Terrorism). Companies with C-TPAT certification are typically more stringent in their security measures, reducing the risk of theft and fraud.
Leverage technology
Leverage tracking devices and other technologies to monitor factors like temperature and light within trailers. Alerts generated by unexpected changes can serve as early indicators of potential security breaches.
On the policy front, legislative initiatives will continue to play a crucial role in mitigating cargo theft risks. Laws such as the Household Goods Shipping Consumer Protection Act and the proposed Safeguarding Our Supply Chains Act represent major advancements toward a secure logistics environment. These regulations equip authorities with the necessary tools to enforce compliance and protect legitimate businesses from fraud.
By implementing these strategies and leveraging legislative measures, shippers can effectively safeguard their operations against cargo theft and secure a more resilient supply chain in 2025.
Freight Market Brief: Expectations for Demand, Capacity, & Linehaul Rates
Top of mind for many shippers and carriers in the transportation industry is when the freight market will turn. Breakthrough's economic and market research does not anticipate sustained year-over-year freight demand growth until May 2025.
Until the turn, shippers are enjoying the ease that comes from plenty of available capacity and favorable rates. Aside from a few regional pockets or lanes where capacity is difficult to source based on equipment type, the current market environment enabled shippers to secure favorable rates in 2024 negotiations. RFP results can give indication on the future freight market based on how carriers are bidding. Although, RFP savings are still “paper rates” and shippers need tools to ensure they execute on those committed rates.
Going into spring RFPs, shippers are taking a few different strategies:
- Place additional price pressure on carriers while capacity is high, and demand is low to save as much as possible in anticipation of the price hikes to come.
- Continue to grow volumes with strategic asset-based carriers to protect from volatile brokerage rates when the market turns.
- Show interest and investment in developing new meaningful carrier relationships for when demand increases, and they need a reliable partner.
Freight Demand
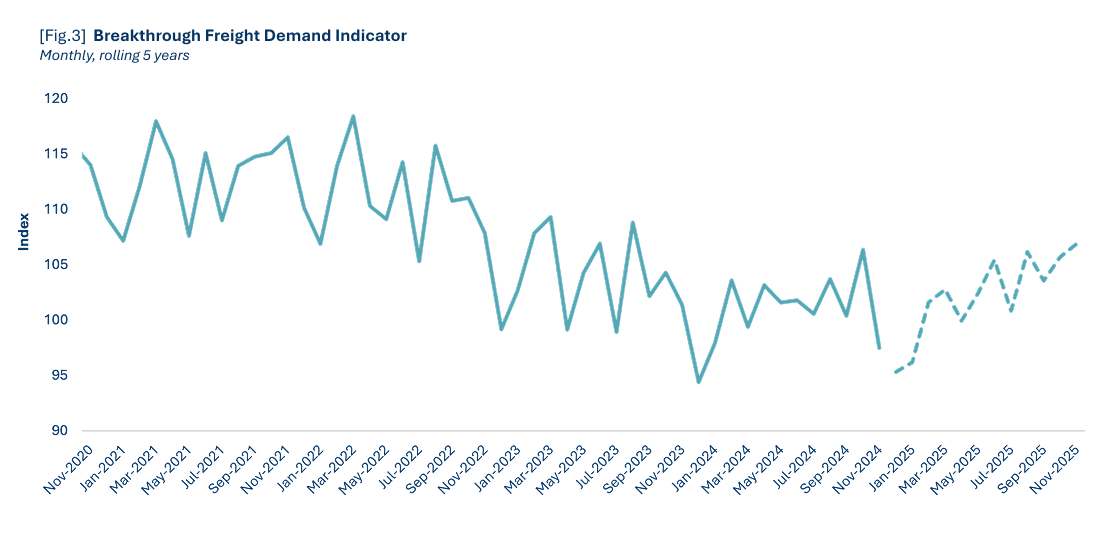
We expect sustained year-over-year growth to begin in May 2025. Our 12-month Freight Demand Indicator Forecast projects an average increase of 1.4% compared to the previous year. This suggests growth in the quantity of truckload and intermodal shipments will return near its 1% annual trend experienced prior to the pandemic.
We expect demand to either decline or experience minimal growth through April 2025, averaging -0.5% during this period. However, beginning in May through the end of our forecast, we expect continuous growth with an average increase of 2.6%.
Intermodal
Intermodal traffic, which accounts for approximately half of all rail activity, is expected to continue its robust growth trajectory into 2025. Carloads rose year-over-year every month since November 2023. Throughout 2024, intermodal volumes consistently remained within 3% of the five-year average, reflecting stability in this mode of transport. There are multiple factors that contribute to the persistent growth of intermodal volumes.
- As the freight market remains at its low point and linehaul rates are attractive to shippers, shippers are utilizing intermodal to find cost savings and establish new partners in this mode of transportation to solidify its position in the market as volume increases and the market turns. Converting to intermodal on lanes above 750 miles could see savings of 5-25%.
- Service has improved across rail networks, taking away the largest disincentive to utilizing intermodal. Even with intermodal volumes increasing, rails have been able to keep service levels better than they historically have. This is positive as the freight market turns, intermodal service levels could hold up and provide more benefit for shippers using this mode.
- The long-term decline in coal volumes, which fell over 13% in 2024, has created increased rail capacity for intermodal and other carload types—a trend expected to persist. Railroads are compensating for the loss of coal freight by expanding intermodal services to maintain train utilization. This downturn in coal is attributed to lower natural gas prices and a temporary industrial production slowdown, with further pressure stemming from widespread decarbonization efforts.
- Shippers can drastically reduce their carbon emissions by utilizing intermodal. Switching from truckload to intermodal can reduce emissions by 50-70% on long haul shipments.
Capacity
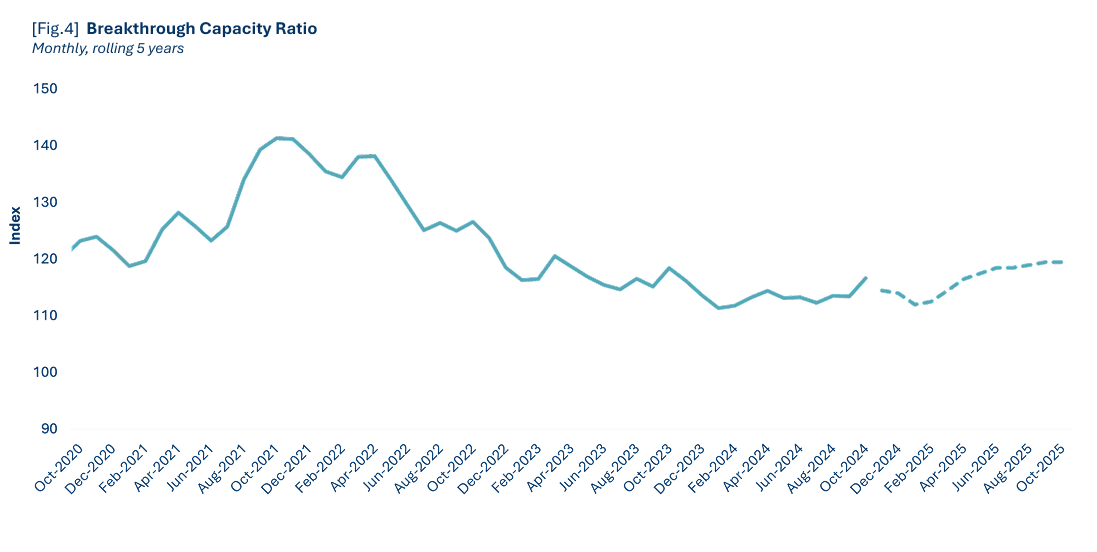
The capacity ratio, which highlights the relationship between freight demand and available capacity in the market, remained at its floor in 2024 – due to lower freight demand and sustained capacity. Although we’ve experienced a prolonged downturn, capacity was slow to exit the market. This is likely due to the record profits during the prior market upturn supporting carriers through the extended downturn. The market is expected to tighten in 2025, with our forecasted capacity ratio curve indicating a 2.4% increase compared to the previous year. In 2024, lower freight demand and elevated capacity caused truck orders and sales to remain subdued and not exceed replacement levels.
Linehaul Rates
The mix of contract and spot rates is normalizing, trending toward a 75-25 split that is expected to hold steady until the freight market begins its anticipated turn. Spot rates gaining a larger share of shipments could serve as an early indicator of this market shift.
We are observing a consistent decrease in the contract market (both dry and reefer), of approximately 3% year-over-year. We expect these growth rates to stabilize before turning positive at the start of 2025, with sustained positive growth anticipated to commence in May 2025. This gradual recovery aligns with broader market dynamics, where steady growth is projected throughout the year, barring any major disruptions that could lead to sudden rate spikes. A potential East Coast port strike on January 15th presents a significant risk to forecasts. The likelihood of a strike seems high, especially after President Trump expressed support for the International Longshoremen’s Association (ILA) and its opposition to automation. The end of 2024 showed a tightening in regional markets due to seasonal demands. Additionally, rising concerns over potential trade tensions with China have prompted shippers to accelerate freight movement in the coming months. This trend is expected to have the greatest impact on the western regions of the U.S., potentially sparking a quicker recovery in the freight market and driving year-over-year growth sooner than projected.
![[Fig. 5] - Line chart showing total, contract, and spot dry van linehaul rates per mile from October 2023 through October 2025. All three rate types generally move together, declining slightly into early 2024 before stabilizing and gradually rising throughout late 2024 and 2025. Contract dry van rates decrease year‑over‑year by roughly 3% before leveling off and turning positive in early 2025, with steady growth projected through May 2025 and beyond. Spot dry van rates remain lower but begin gaining share as the market approaches a potential turning point. Forecast curves show gradual rate increases through the remainder of 2025. [Fig. 6] - Line chart showing total, contract, and spot refrigerated (reefer) linehaul rates per mile from October 2023 through October 2025. Rates fluctuate through 2023 and early 2024, dipping mid‑2024 before gradually trending upward. Contract reefer rates show a similar year‑over‑year decrease near 3% before stabilizing and shifting to positive growth early in 2025. Spot reefer rates show wider month‑to‑month variation but trend upward in the 2025 forecast. By mid‑2025, all three rate categories show sustained growth, consistent with expectations of tightening market conditions and potential disruptions such as seasonal demand shifts or geopolitical risks.](https://big-comfort-7ce80fc531.media.strapiapp.com/freight_trends_fig_5_6_55672cc9dd.png)
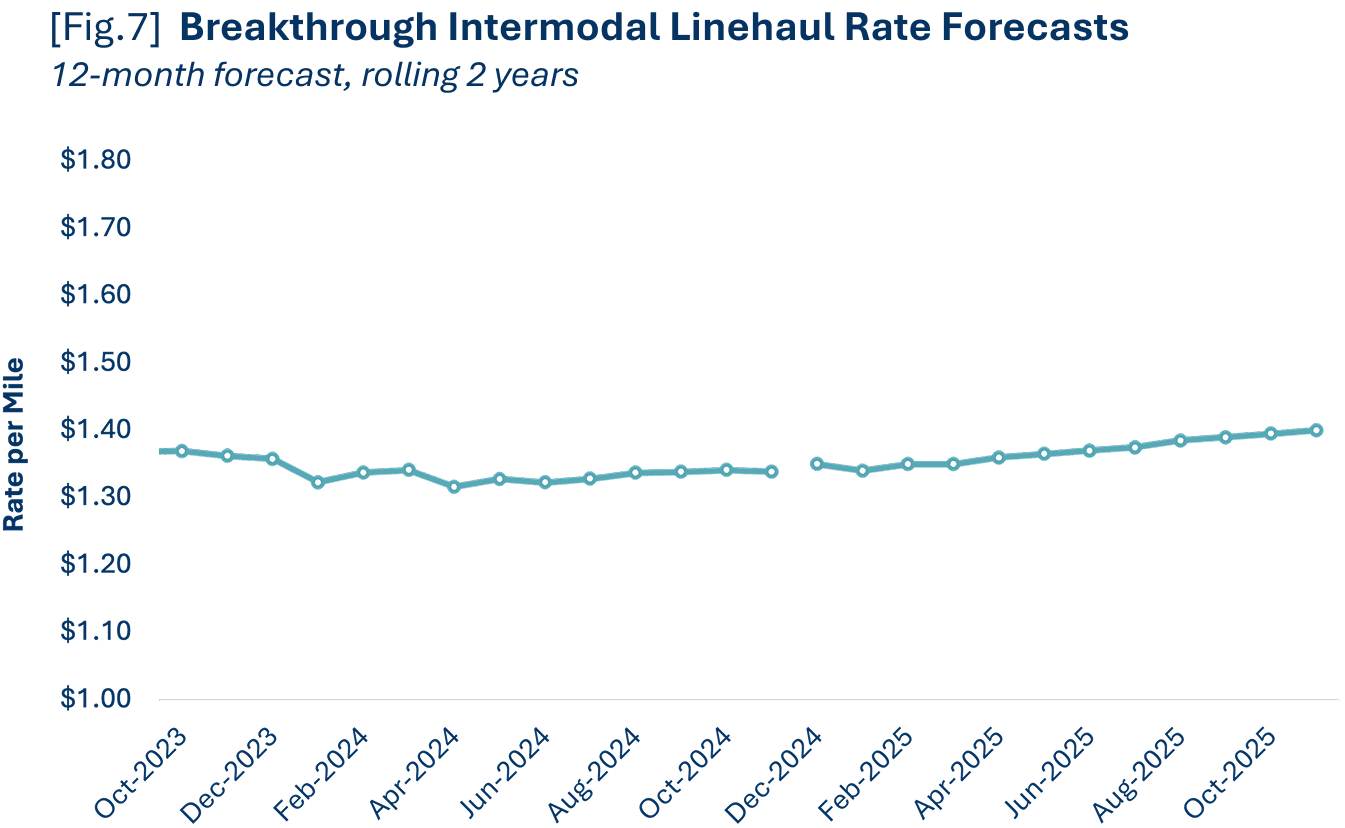
Intermodal linehaul rates remained relatively flat throughout 2024 (raising 1.9% from January 2024), however, they declined roughly 8.5% from 2023 average levels. We expect rates to rise by 2.6% year-over-year as volumes continue to compete for space on the train and the freight market turns.
Breakthrough Forecasts: Full Year 2025
With assumptions that the growth rate will accelerate throughout 2025, our projections for the full calendar year are as follows:
| 3.2% Dry van contract rates | ||
| 9.0% Dry van spot rates | ||
| 3.1% Refrigerated contract rates | ||
| 5.8% Refrigerated spot rates | ||
| 2.6% Intermodal rates | ||
Forecast Accuracy
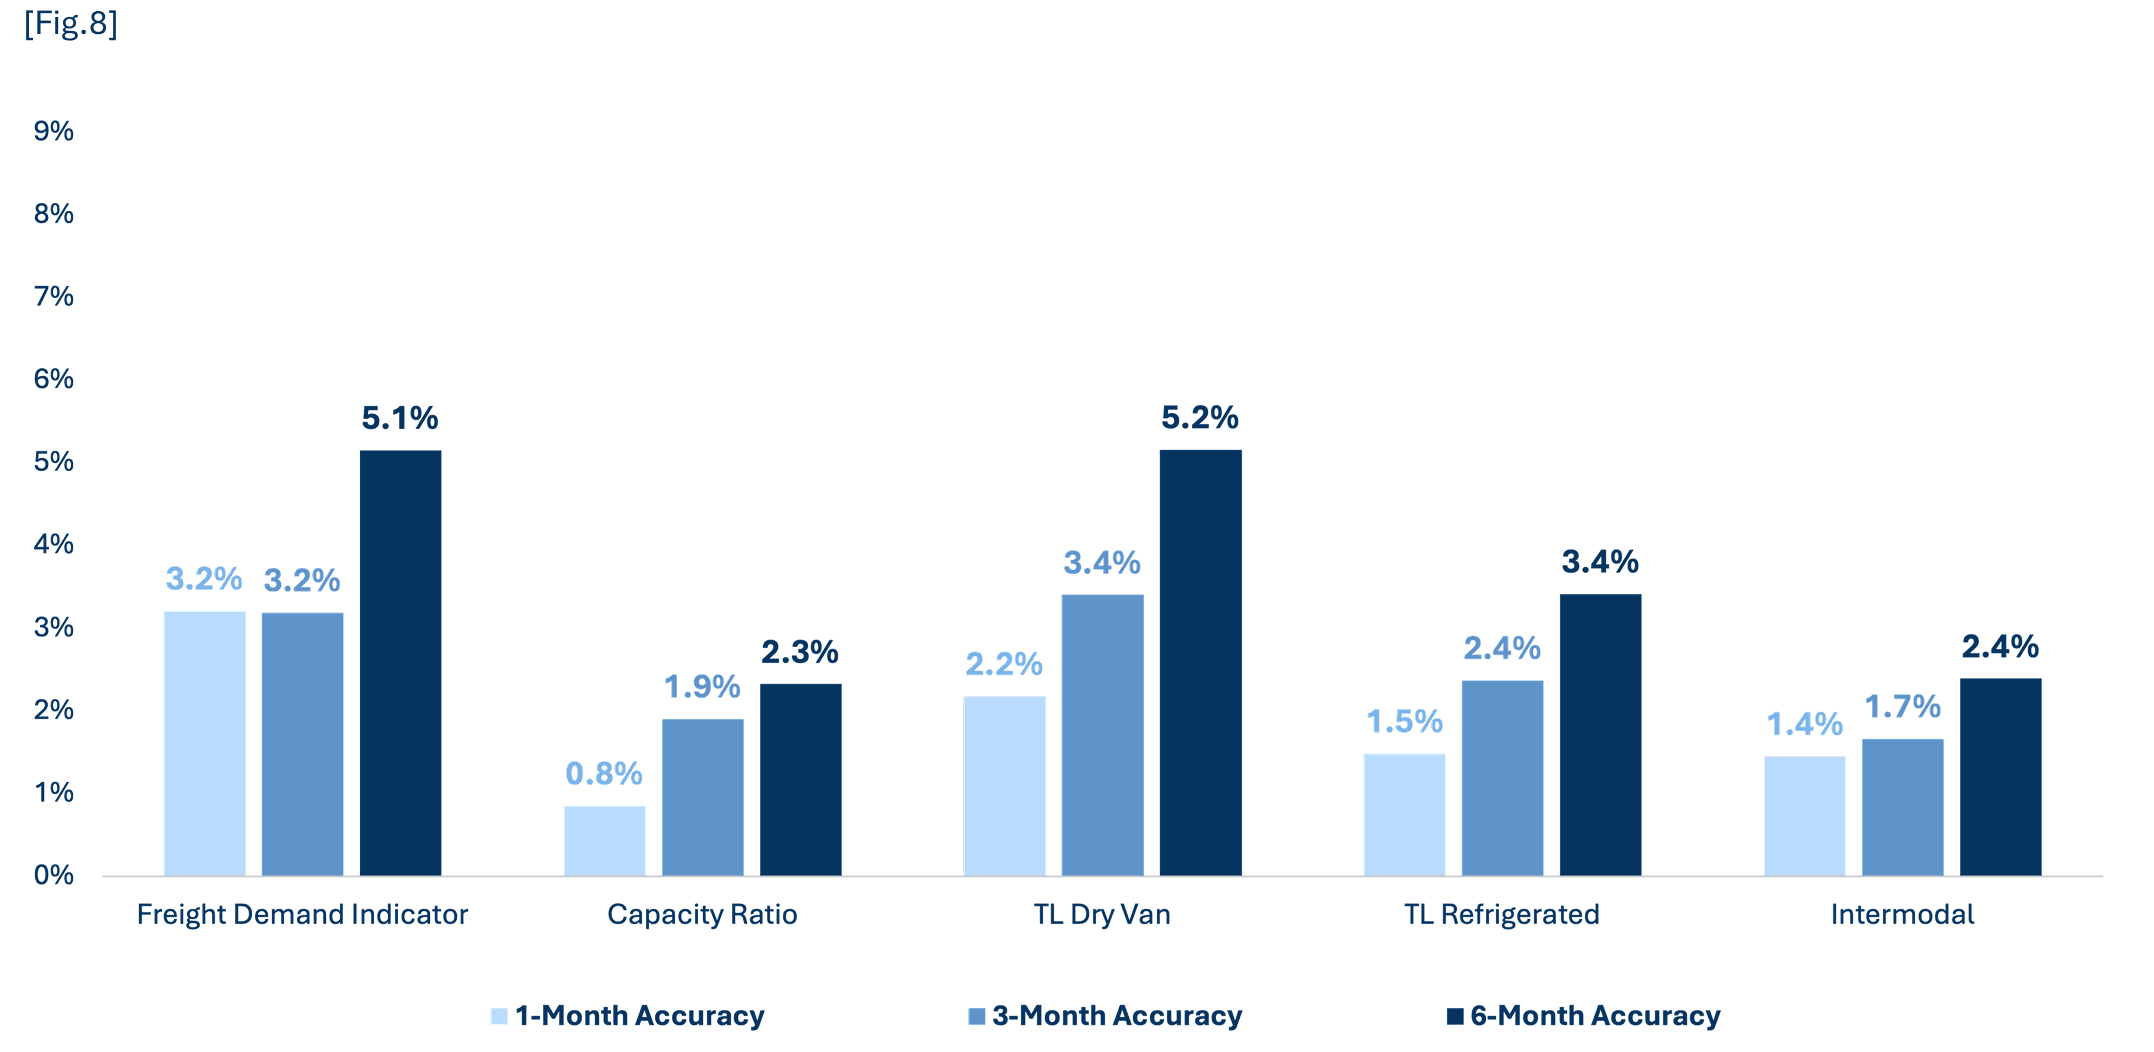
Breakthrough updates our freight forecasts on a monthly basis in our Freight Advisor to provide updated perspectives based on recent market moves and account for market shocks. In addition to these updates, we provide the accuracy of our forecasts.
Analyzing the prior 12 months of forecasts, you can see how accurate we are on 1-month, 3-month, and 6-month intervals. We believe it is important to provide forecast accuracy to allow shippers to use our perspective and outlook to their full advantage.
Ready to transform your freight strategy in 2026?
Explore how Breakthrough’s transportation network management solutions can help you unlock efficiency, reduce costs, and stay ahead of industry trends.

Download the report
Take the full 2025 Freight Trends Report with you. Download your copy to save these insights for future reference or to share them with your team.