5 min read
How to Select Carriers to Meet Your Sustainability Goals
November 5, 2024
Share:
Table of contents
Browse the table of contents to jump straight to the part you’re looking for
Executive Summary
With an increase in policy for emissions reduction, many shippers are feeling pressure to implement sustainable processes that reduce their carbon footprint. One way to significantly reduce emissions is through carrier selection. Each carrier has a different mile per gallon (MPG) average and some have tractors that consume alternative transportation energy in their fleet. SmartWay, an Environmental Protection Agency (EPA) program that helps track, calculate, and compare fuel consumption and emissions across the transportation industry, is a great starting point for shippers. Carriers with SmartWay scores provide shippers with the criteria to understand the emissions intensity of the shipment with that carrier.
In this report, we guide you on how to build an absolute emissions baseline, introduce SmartWay and offer advice to encourage carrier participation, and suggest additional criteria to consider for carrier selection. With our guidance, you can make progress toward reducing carbon emissions.
Key Takeaways
- Understand your emissions baseline. The first step in acting on emissions reduction is to understand the starting point. Calculating carbon output will establish the emissions baseline and provide the metrics needed to develop science-based targets.
- Encourage your carriers to participate in SmartWay. SmartWay provides the means for shippers to analyze carriers on a scale of one to five to understand their level of efficiency. It is often the start to understanding how carrier choice can influence and inform a better strategy.
- Select carriers that meet your sustainability goals. Once carriers receive a SmartWay score, it is easier for shippers to make an educated decision that will help improve their fleet strategy, promote benchmarking, and spark continuous improvement in the partnership.
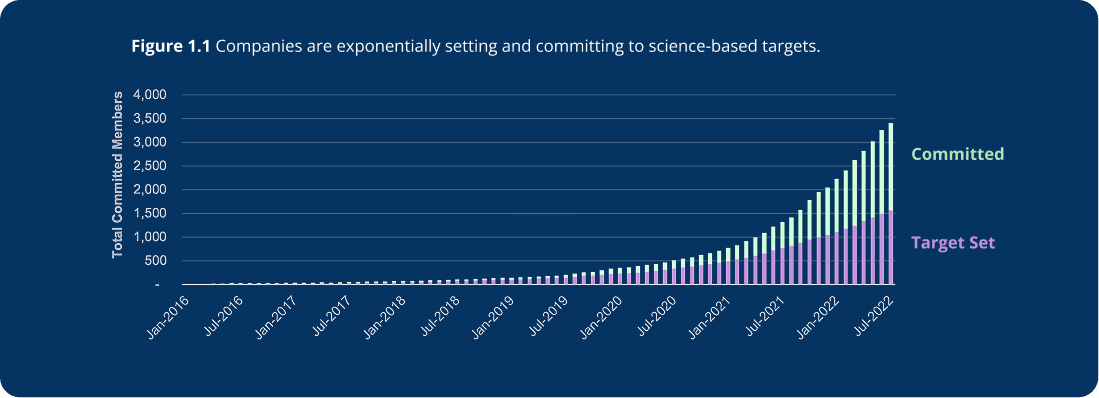
Science-Based Targets Begin with a Baseline
Companies are setting science-based targets at an accelerated pace, but many do not have a baseline to support their emissions reduction roadmap. To build a baseline, absolute lifecycle emissions of scope 1, 2, and 3 and emissions intensity are needed. Scope 3 emissions are the largest category and the hardest to measure and improve, with transportation being the leading contributor. While challenging, reducing scope 3 emissions has the largest impact on making positive change for the planet without sacrificing efficiency. Many companies are partnering with strategic, data-driven transportation technology providers who can guide them through the process to set and achieve science-based targets. Before starting this endeavor, we collected some valuable information to consider.
Data Can be Found Across Your Entire Inbound and Outbound Transportation Network
Finding data to understand your emissions intensity and absolute lifecycle emissions can seem like a daunting task – but it doesn’t need to be. By collecting data from internal and external partners, you can begin to calculate your emissions output and build a meaningful emissions baseline. You may receive hesitation or push-back from carriers or internal team members when requesting information, but approaching the situation by explaining the value of the data and the value of a strategic, data-driven relationship will allow the partner to understand your intent.
Establish Ongoing Processes
Emissions tracking isn’t a project, it’s a process. While collecting information for your baseline, write a standard operating procedure (SOP) for ongoing emissions tracking and analysis of data. Not allowing time for robust data collection to inform your baseline can lead to difficulties in reducing your carbon footprint. As your company grows, each acquisition, team member, and volume of business will add or subtract from your emissions intensity. Being specific in the categorization and calculation is imperative to the overall emissions you will need to either reduce or pay for through carbon offsets. By effectively organizing the data early on, you will be able to flag operational areas that generate a sizable number of emissions and can be switched to a lower emissions solution.
You Can’t Improve What You Can’t Measure
Once your company agrees on a science-based target, it is important to work the target backward to set achievable goals. Communicating manageable key performance indicators (KPIs) will gain the support of team members who believe in the target and are willing to evolve traditional methods to sustainable practices. Often, companies become more efficient because of analyzing processes that haven’t been changed in years and by reducing fuel spend because of an increased MPG.
Companies have several tasks to complete before setting a science-based target. Collecting data from internal and external sources, establishing a process, and setting manageable KPIs are all a part of building an emissions baseline. You can drive real progress toward your corporate sustainability goals by understanding where and how to reduce scope 3 transportation emissions.
Emissions Reduction Dictionary
Sources: EPA SmartWay & Science-Based Targets |  | |
Pressure to reduce carbon in supply chains continues to grow...
- 42%: Consumers that have changed consumption habits based on their environmental stance. Source: Deloitte
- $43 Trillion: Asset value at risk as a result of climate change. Source: TCFD
- $369 Billion: Allocated to fund energy and climate projects aimed at reducing carbon emissions by 40 percent by 2030. Source: The White House
An Introduction to Smartway
SmartWay, launched by EPA, was developed for shippers, carriers, and other stakeholders to measure, benchmark, and improve supply chain operations to reduce their carbon footprint. Participation in the program allows shippers to quickly identify which carriers operate most efficiently while others have room for efficiency improvements. We identified that an improvement in two SmartWay categories corresponds to a carrier emissions reduction greater than 11 percent. One of the best parts about the voluntary program is it is easy to implement in your supply chain!
How does SmartWay scoring work for carriers?SmartWay ranks carriers with a score from one to five, one being the highest score and most efficient, while five is the lowest score and least efficient. Each rank corresponds to grams per mi CO2. Because CO2 is closely tied to MPG and fuel usage, these metrics depend on the fleet age of the carrier. For example, older trucks commonly show higher maintenance costs and a lower MPG. Non-SmartWay carriers would automatically be assigned to a sixth performance range, which is worse than a rank of five. | Rank | g/mi CO2 | |
| 1 | 1,350 | ||
| 2 | 1,450 | ||
| 3 | 1,550 | ||
| 4 | 1,650 | ||
| 5 | 1,750 | ||
Encourage carrier participation in SmartWay
SmartWay is becoming more popular in the supply chain and will become a key differentiator in the future for both shippers and carriers alike. Both shippers and carriers can participate to learn their SmartWay score to benchmark their carbon footprint across the supply chain. Carriers complete a concise survey each year, with the first year requiring the most information. Carriers can then use this data to understand and improve their performance. The SmartWay site offers resources for incentives, grant programs, and a calculator to understand the cost of investing in electric trucks.
Encouraging carrier participation may be a challenge, but it is valuable information to help meet your sustainability goals. SmartWay shares an excel file with carriers that are registered along with their rating for an efficient lookup method. This is an efficient way to understand the carbon footprint of each carrier in your transportation network. Communication with carriers will help them understand your intent. To aid this discussion, we compiled some benefits:
- Participation in SmartWay provides you with a score that is reflective of your fuel consumption and emissions across the transportation sector, instead of automatically assigning you to the sixth performance range.
- SmartWay is progressively becoming more widely used across the industry. Participation will inform overall emissions and offer the opportunity for improvement, if needed, before it becomes more widely used.
- SmartWay promotes benchmarking. By participating in SmartWay, you can understand how you compare against your competition and how shippers will decide whether to contract with you for their freight.
SmartWay is one of the first steps for carriers to quickly receive a scorecard on their emissions output. In receiving a score via answering a brief survey each year, the program will allow carriers to efficiently track their emissions output and show year-over-year progress. Shippers and carriers can benefit from the voluntary program to benchmark against competition. For shippers, the score allows you to select carriers that operate more efficiently to lower your overall emissions. To encourage participation, it is important to celebrate achievements such as completing the survey, incentives for receiving a certain score or recognizing the progress made over the prior year.
Revolutionize Your Transportation Network Strategy: Criteria to Consider for Carrier Selection
Historically, carrier selection was based on cost, capacity, and service. With the passing of the Inflation Reduction Act, carbon has become an additional consideration in carrier selection. Now, the question for shippers is what is your science-based target and how are you making progress compared to plan? In addition to participation in SmartWay, energy choice, mode choice, average MPG, and load fill are all criteria that you can evaluate to reduce overall emissions.
Energy Choice
Alternative fuels continue to displace diesel fuel usage in specific geographies. Biodiesel, renewable diesel, fossil natural gas, renewable natural gas (RNG), hydrogen, and electricity are some of the prominent alternative transportation energies that are receiving investment for research and development. Nationally, alternative energy accounts for roughly 8 percent of the heavy-duty market, with California being a leader at 36 percent.
[Figure 1.2]
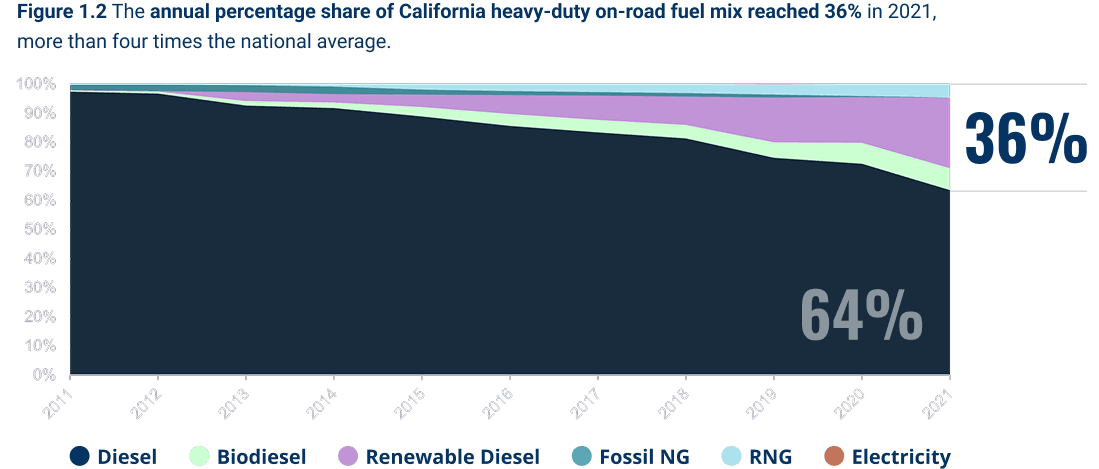
Switching to fleets with alternative energy can offer substantial fuel savings and emissions reduction, especially when looking at targeted markets where energy cost savings and incentive programs can aide your strategy. For example, a lane from Ontario, CA to Tracy, CA on June 20, 2022, had a fuel savings of 40% fuel savings and 300% emissions reduction when the production source of alternative energy was identified and measured. Understanding how your energy is sourced and how it can complement your initiatives will help you make progress toward your science-based target.
Mode Choice
Evaluating your transportation network for opportunities to switch to intermodal can offer a substantial reduction in emissions and can add value to your transportation network. Switching to intermodal has been shown in Breakthrough data to reduce emissions on a load by up to 50 percent. For example, converting 25 percent of 789 loads to intermodal across 7 eligible lanes would provide:
- $35K Estimated fuel cost reduction
- 19K Estimated gallon reduction
- 200MTCO2e Estimated emissions reduction
When considering intermodal, it is crucial to understand if the prospective route is still optimal for your transportation network and feasible to convert. To add, selecting a carrier that offers rail and truckload capability in the same container, also known as an intermodal marketing company (IMC), is one of the most effective ways to transport goods.
Average MPG
Selecting carriers with a higher mile per gallon average will reduce fuel consumption and reduce cost. Carriers that participated in the North American Council for Freight Efficiency’s (NACFE) Run on Less Regional program showed that class 8 tractors—both diesel and CNG—can use a combination of technologies and driver behavior to achieve optimal fuel economy received an average of 8.3 MPG for fleets with CNG and Diesel trucks, and 8.7 MPG average for fleets with diesel-only trucks.
Carriers that participate in SmartWay will also offer a score that will identify their operational efficiency. It is important to consider weight of load when setting a MPG target for carriers to achieve. Setting a MPG target for carriers to achieve naturally reduces their fuel consumption, emissions, and cost. Breakthrough shippers are on pace for an annual reduction of 15.5 million gallons and 153k metric tons of emissions because of setting these attainable targets.
You Can Reduce Your Overall Emissions: Select carriers to meet your sustainability goals
Selecting carriers to meet your sustainability goals can be done in several ways. SmartWay is one of the first methods that can be used to track fuel consumption and emissions output of a carrier across the transportation sector. Energy choice, mode choice, average MPG, and load fill are also options that will provide you with the information needed to understand your overall transportation network emissions. It is important to begin the process by calculating an emissions baseline to inform a science-based target. Third-party partners, specifically partners that specialize in transportation, will be experienced in guiding you through the journey to reach and maintain your science-based target.
Transportation Policy
With the Inflation Reduction Act of 2022 signed into law on August 16, the bill provides $369 billion to fund energy and climate projects aimed at reducing carbon emissions by 40 percent by 2030. The bill also extends tax credits for alternative fuels and fueling stations, and provides $1 billion in new grants for clean heavy-duty vehicles. This level of investment is necessary to build the infrastructure to support lower emission tractors.
Ready to align your carrier network with your sustainability goals?
Breakthrough’s CleanMile solution helps you measure and manage emissions, empowering you to select carriers that drive meaningful progress toward decarbonization.

Download the report
Take the full How to Select Carriers to Meet Your Sustainability Goals report with you. Download your copy to save these insights for future reference or to share them with your team.