Breakthrough's Monthly Freight Index
Breakthrough's Monthly Freight Index is your monthly source of information on the U.S. freight market. Based on transaction data from carriers in Breakthrough’s database, it provides transportation industry leaders with an up-to-date view of market trends, enabling you to take action with complete confidence.

Freight Index Analysis
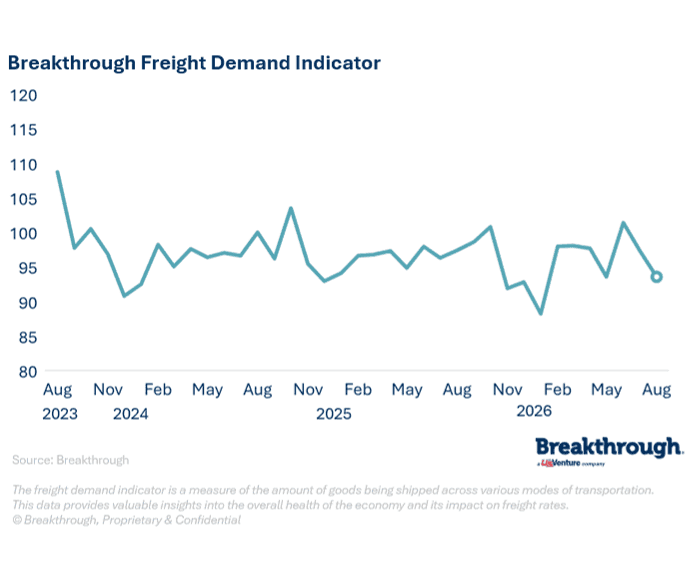
Breakthrough Ecosystem volumes slipped back into negative territory in August, down 0.2 percent year over year and erasing July's modest gain. Retail, up 5.7 percent, and paper and packaging, up 2.7 percent, remained the only sectors above prior-year levels, though both decelerated from recent peaks. Retail growth is concentrated in value formats such as off-price and general merchandise. CPG fell 4.9 percent, food and beverage 2.5 percent, and durable goods 2.2 percent as mortgage rates near 2026 highs weighed on housing-related freight.
The tariff pull-forward has unwound, and the Fed's September rate hike combined with diesel above $6 per gallon will add some pressure to consumer budgets. The Breakthrough Freight Demand Indicator forecast ticks down to 1.5 percent year over year from 1.6 percent last month. A meaningful recovery would require spending to broaden beyond value channels or stronger industrial demand.
Freight Market Update
Published: October 1, 2026
The Breakthrough Ecosystem slipped to a 0.2 percent year-over-year decline in August as retail and paper and packaging cooled while CPG, food and beverage, and durable goods fell further. The Federal Reserve's September rate hike and diesel above $6 per gallon are squeezing household budgets and carrier margins, and August's retail sales gain was driven largely by energy prices. Capacity remains tight.
Primary tender acceptance is still down relatively to last year but trended up slightly in August. The dry van spot-contract gap continued to narrow this month as contracts reprice. Spot rates are expected to hold near current levels with a seasonal lift into year end, while contract rates were revised slightly higher.
What is affecting freight demand right now?
The demand for freight transportation reflects a combination of macroeconomic pressures and changing market dynamics.
Each of these dynamics has direct implications for how carriers plan, contract, and evaluate their transportation networks.
Understanding what is driving the current market and what this means for your network is the first step toward making confident, data-driven decisions in today’s rapidly changing environment.

Macroeconomic factors
A September Fed rate hike, 3.4 percent inflation, and diesel above $6 per gallon are squeezing consumers, while manufacturing remains a bright spot.

Industry and sector dynamics
The retail, paper, and packaging sectors are driving freight volumes, while the durable goods, food and beverage, and consumer goods sectors remain below last year's levels.

Policy drivers
Cabotage enforcement, cross-border visa uncertainty, and CDL restrictions are tightening truckload capacity, while tariff pull-forward volume has unwound.
What does this mean for shippers?

Data-Driven Decisions
A comparison with shippers' transaction data reveals cost differences, opportunities for improvement, and a stronger negotiating position with carriers.

Evaluate your combination of operators
Reviewing the mix of carriers by route and identifying potential alternatives can help maintain service levels and manage costs.

Plan for a Gradual Recovery
Leverage unbiased, data-driven market insights to effectively communicate market dynamics to your management team, thereby strengthening your credibility as a leader in the transportation industry.
About the Breakthrough Dataset
The Breakthrough ecosystem is one of the most accurate and reliable transportation datasets in the United States.

46.5 million shipments
$35 billion in transportation spending

16.5 billion commercial miles

2.5 billion gallons of diesel fuel
Frequently Asked Questions
Stay on top of changes in the freight market
The freight market never stops. Shippers must stay informed, plan ahead, and act based on real-time data for each route.