5 min read
March 23, 2026
Iran War: Energy Market Impact Tracker
Track the Iran War's impact on energy markets. Use our daily update and real-time insights to protect your transportation budget. Read the latest today.
Read more8 min read
December 13, 2018

Share:
Table of contents
Browse the table of contents to jump straight to the part you’re looking for
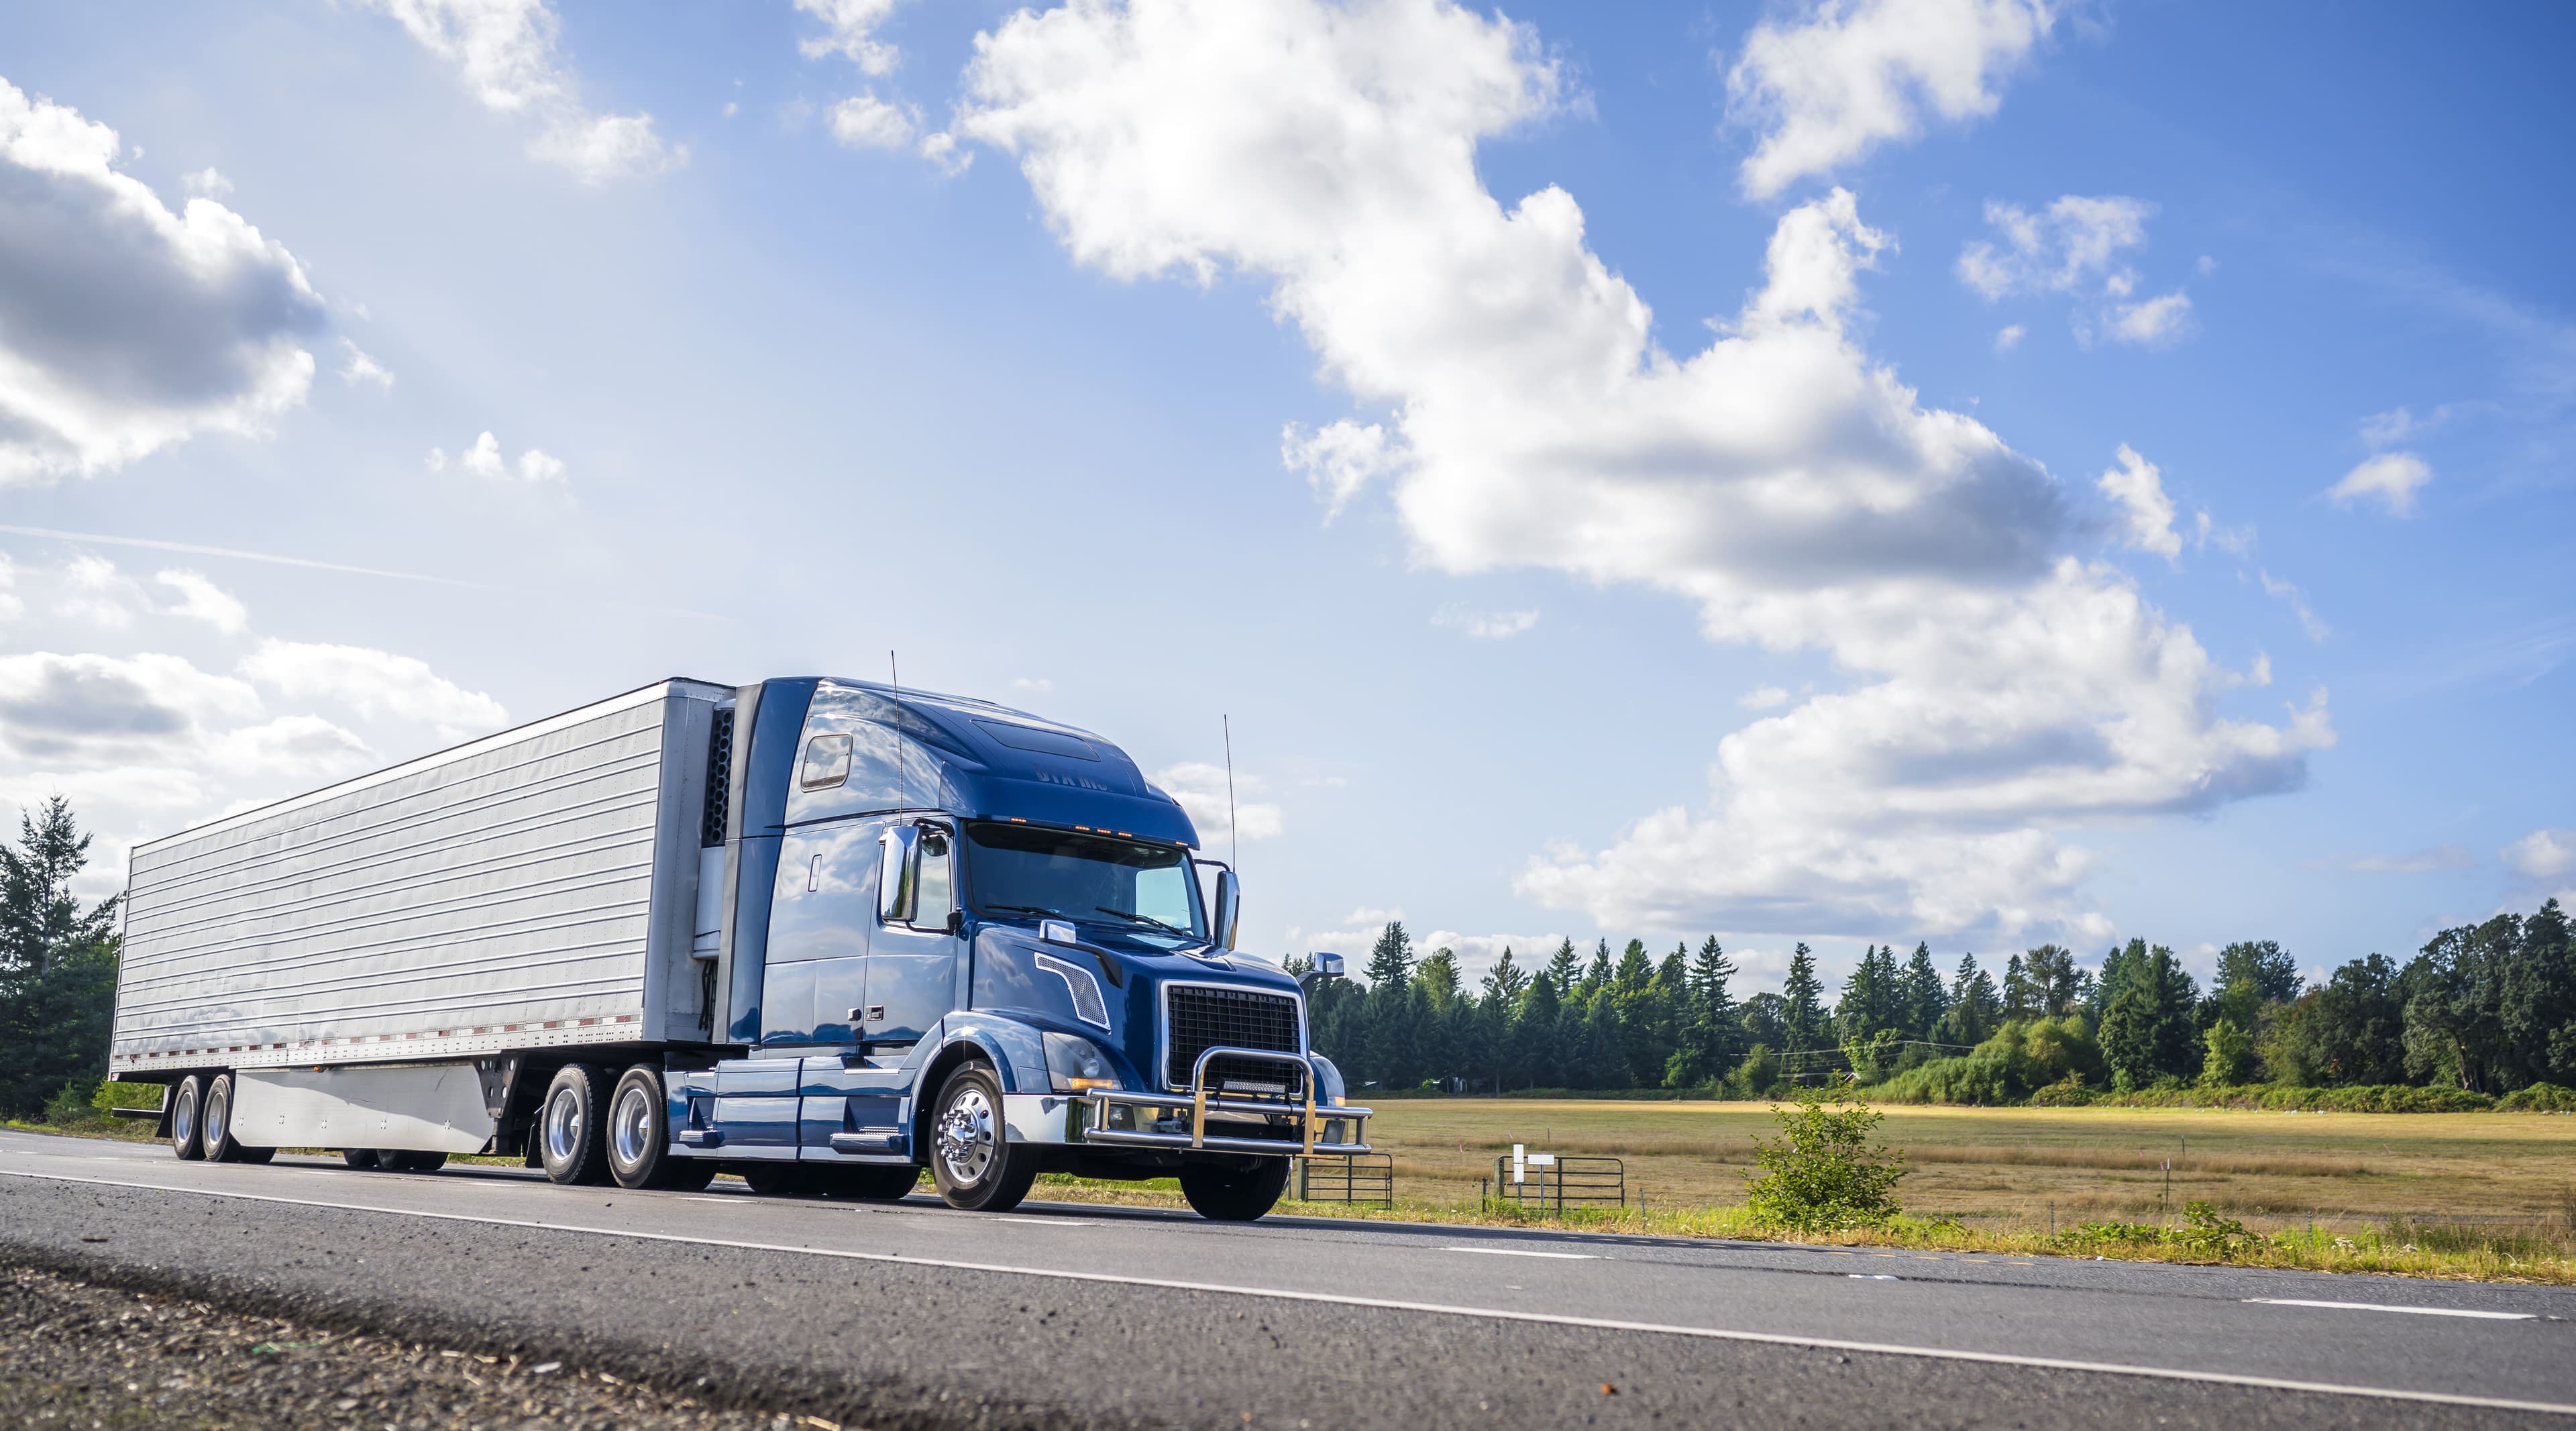
Understanding the intricacies of supply and demand dynamics in the transportation industry involves a careful analysis of factors that may, or may not, appear related. In terms of capacity, key indicators include the number of trucks on the road, the number of drivers available to operate them, and the demand from shippers needing to move goods to market. This ecosystem that directly influences important cost inputs in transportation is why 2018’s truck ordering trends have been at the center of both headlines and conversations in the board room.
But diving deeper into the underlying implications of these types of numbers and reports requires a more thorough look at a micro-level and then applying any findings to individual freight networks.
Let’s dive in.
US truck dealers and fleets placed 45,000 class 8 truck orders in August 2018, reaching a 10-year high. This amount surpassed the next highest monthly total last reached in October 2014 by over 5,000 orders. Truck orders have been surging the past twelve months, never dipping below a level of 25,000 orders per month since October 2017. Prior to October 2017, truck orders averaged about 15,000 orders per month. This equates to approximately a two to three-fold increase over historic levels. While September and October numbers decreased by 10,000 to about 35,000 orders, today’s truck ordering environment is still incredibly fast-paced—and the industry is taking note.

Source: Bloomberg Terminal
Truck orders are being featured in the media and they are a topic of conversation in the board room, but what is the significance of an elevated truck order marketplace—and more importantly, why does this matter for shippers?
Below are two reasonable arguments regarding elevated truck orders.
Truck orders can represent confidence among truck dealers that their trucks will soon be sold to a fleet. A new truck order is also an indication to fleets that these assets are expected to produce future linehaul revenues. For shippers, new trucks entering the marketplace might mean that more trucking capacity is being added to the marketplace to haul their freight. This, of course, is contingent on whether carriers are simply replacing their existing equipment or adding new vehicles to their fleets incrementally above their rate of replacement (which we expound upon below). Shippers must also consider whether order levels are enough to keep up with increasing demands for capacity in an accelerating freight market.
Truck order metrics are not an easy way to think about current or future changes in trucking capacity.
An alternative way to think about changes in trucking capacity is to convert the monthly trucks ordered into monthly truckloads equivalents. If we use the TCA (Truckload Carriers of Association) figures of average loads per truck per week, we will use 15 loads per tractor per month.
When shippers see that 45,000 trucks have been ordered per month, following the logic above they might convert this to a potential capacity addition of 675,000 loads per month—or 8.1 million loads per year. This, however, is not a fully transparent assumption considering the likely replacement rate for new truck orders.
If we consider an implied replacement rate of about 15,000 trucks per month, which is more in line with the monthly order rates we saw in mid-2015 and early 2016, perhaps the incremental gain above the rate of replacement is about 30,000 trucks. This 30,000 incremental truck gain would result in a capacity gain is close to 450,000 loads per month (e.g. 15 loads per month * 30,000 trucks).
Of course, this method illustrates the potential for capacity additions based on historical industry benchmarking and assumptions, not the net effect accounting for the true replacement rate and timing of the actual delivery of trucks into each fleet.
In an environment where hauling capacity is constrained and linehaul rates are trending upward, truck dealers and fleets may be scrambling to order enough trucks to fulfill demand. Amplifying matters, the US trucking dealer community is expansive and quite fragmented – according to IBIS world, most likely with independent forecasting and fulfillment operations. Expanding the complexity of this marketplace even further, for-hire truckload fleets are divided up into well over 150,000 businesses, and private fleets are vast across the marketplace.
As dealers replenish their truck inventories, it is possible that a backward view of demand might contribute to an overall ramp-up in orders nationwide. As truck dealers and fleets have found more recently, orders to be placed in the trucking OEM’s build plan. In August 2018, the current backlog to deliver an ordered class 8 truck was over nine months – also a 10-year high. It’s possible that this long delay increases the sense of urgency among competing fleets, who may be ordering more equipment than would previously be necessary to capture their desired share of the trucks coming online.

Source: Bloomberg Terminal
We should also note that the Tax Cuts and Jobs Act, enacted in late 2017, likely spurred additional demand for trucking equipment. In the wake of the new legislation, tax accounting practices now permit companies to fully depreciate equipment purchases in year one, thereby lowering effective tax rates immediately. In fact, the law’s effective date for accelerated depreciation was September 27th, 2017, and in October 2017, truck order numbers doubled September totals. Whether this was simply a coincidence or a measurable result of these legislative changes remains unclear, however, the trend that emerged is compelling.
Carriers may face the possibility of unseated or idle trucks if they are, in fact, expanding their fleet size and need to hire more drivers. Multiple publications cite carriers increasing driver wages to attract labor from other industries. A highly competitive environment for truck drivers has also exacerbated driver turnover woes for fleet operators, as drivers seek higher pay rates. Some fleets may also have to adopt different pay structures. This is particularly true among the larger carriers, who have in more recent years opted to serve shorter haul lanes, resulting in lower mileage amounts per truck and driver. Per-mile based wage programs may under-compensate drivers for their work even if with an accompanying wage increase.
We submit that US economic growth is a key driver for truckload freight demand. Expectations are for strong, but not unprecedented, quarter to quarter GDP growth, suggesting a need for gradual expansion in hauling capacity. Whether the expansion in freight demand is well-synchronized with and proportional to, the growth in the supply of trucks is another question. Our sentiment is that the rapid rise and peak in recent truck orders suggests a possible over-expansion in capacity relative to demand.
Looking back to early 2014, the truckload market had just endured the tightest capacity environment in the previous ten years. Q2 GDP had expanded at a strong rate of 5.1 percent, and the capacity environment did not yet have time to adjust. Truck dealers and fleets, responding to the tight capacity environment early in the year, began to ramp up orders reaching a peak of 40,000 in October 2014. Following this peak in orders, GDP growth began to slow to under 1.5 percent which ushered in a more abundant capacity cycle for shippers.

Source: Bloomberg Terminal
Flash forward to 2018 and what do we see? 2018 Q1 GDP growth reached a rate of 2.2 percent, building to a robust 4.2 percent in Q2. Over this same time, Q1 truck orders surged to 107 percent of prior year’s levels and only slowed slightly in Q2, reaching a rate a 95 percent growth rate over last year. By Q3, truck orders increased to 183 percent of the prior year. In contrast to the mid-2015/2016 cycle, 2019 GDP growth doesn’t seem as poised for the same dramatic slow-down as seen at that time. Reading into the 2018 Q3 GDP numbers, however, we see that most of the gains are coming from consumer demand and government spending, but nonresidential business investment was the weakest in 2 years. Additionally, the International Monetary Fund (IMF) is reducing its growth forecast for the first time in two years. All of this suggests some economic headwinds to come.
As we have seen, macro-level indicators like GDP and truck orders give us a broad sense of what is happening in the market, but what does it mean for shippers’ freight and carrier-base? Breakthrough partners with experts in up-to-date truck registration data to articulate specific fleet size changes in the for-hire segment. Beyond this, we have also obtained trailer equipment specs for these carriers, so shippers can better isolate potential fleet expansions and contractions according to whether the capacity needed is flatbed, reefer or dry van. Shippers looking for these insights can partner with Breakthrough Supply Chain to mine this data, harnessing it to inform future freight procurement strategies.
For more information about the data and information provided here about truck orders, capacity, or our Supply Chain solutions, contact us!
5 min read
March 23, 2026
Track the Iran War's impact on energy markets. Use our daily update and real-time insights to protect your transportation budget. Read the latest today.
Read more
6 min read
March 13, 2026
Stop overpaying. Learn how a new approach to energy management that separates fuel from freight gives you cost control, transparency, and fair market-based pricing.
Read more
6 min read
March 12, 2026
The Iran War is causing energy market volatility. Learn how to protect your transport budget with fair and accurate fuel reimbursements for your carriers.
Read more