5 min read
Fuel Recovery: Ditch the DOE
January 1, 2023
Share:
Table of contents
Browse the table of contents to jump straight to the part you’re looking for
Introduction
Historically, the transportation industry has lacked an accurate way to calculate fuel consumption per shipment and the price of fuel along a specific lane on a given date. Most shippers rely on the Department of Energy’s (DOE) index-based fuel surcharge to calculate a fuel reimbursement.
However, using a weekly national average creates significant distortions in fuel costs—especially in today’s volatile energy market. Shippers who continue to rely on this outdated model are missing out on substantial opportunities to reduce transportation fuel costs and optimize their networks.
Shippers can eliminate these distortions by implementing a market-based fuel reimbursement program. This approach delivers lane-level visibility into your transportation network, reducing cost, consumption, and emissions. On average, market-based fuel reimbursements reduce truckload fuel spend by 20% compared to legacy fuel programs.
By accounting for daily fluctuations, a market-based program creates a distinct competitive advantage.
Four Reasons the DOE Index Falls Short
The shortcomings of the DOE index are significant for shippers seeking accurate and fair fuel reimbursements. Here are the four primary reasons why the DOE approach fails:
1. Price
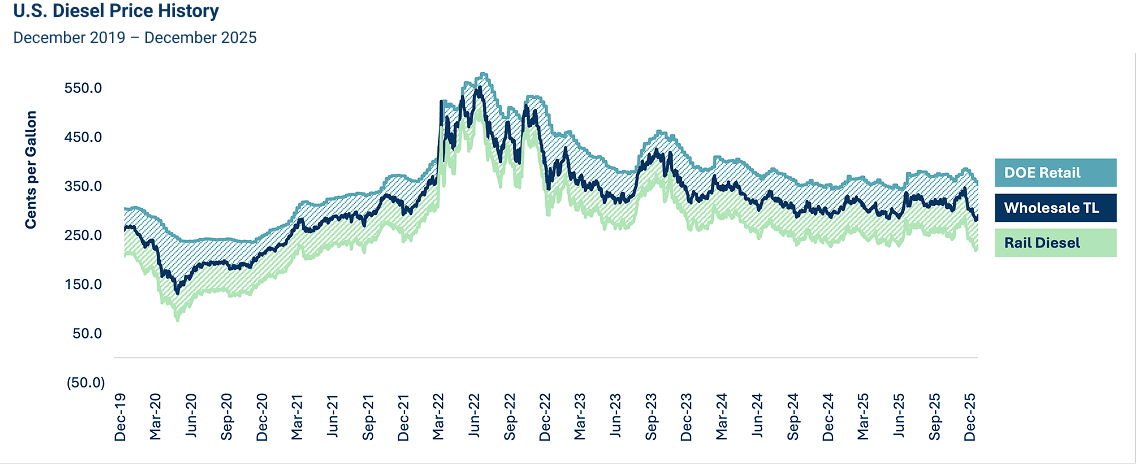
Fuel reimbursements should be fair and accurate between shippers and carriers. To gain transparency, shippers should reimburse carriers at the same price at which their carriers procure fuel. And while the DOE provides a once-weekly, single national price based on a sample of less than 10% of all 53’ accessible fueling stations, most well-managed carriers procure fuel at wholesale pricing.
The chart above illustrates the spread between DOE retail and the national wholesale average, exemplifying the value of a market-based fuel reimbursement program. The spread between wholesale and retail prices has at times reached over one dollar per gallon, but has averaged 52.4 cents per gallon in the last five years.
Breakthrough Fuel Recovery aligns to the true fuel cost. By considering the fuel efficiency of the carrier and the real market fuel prices along lanes, the program takes a strategic approach to transportation management.
2. Time
Diesel prices fluctuate daily and are one of the most volatile cost inputs affecting the transportation industry. When shippers use the DOE index to calculate their fuel reimbursements, they miss drastic price swings that occur throughout the week, resulting in overpayment.
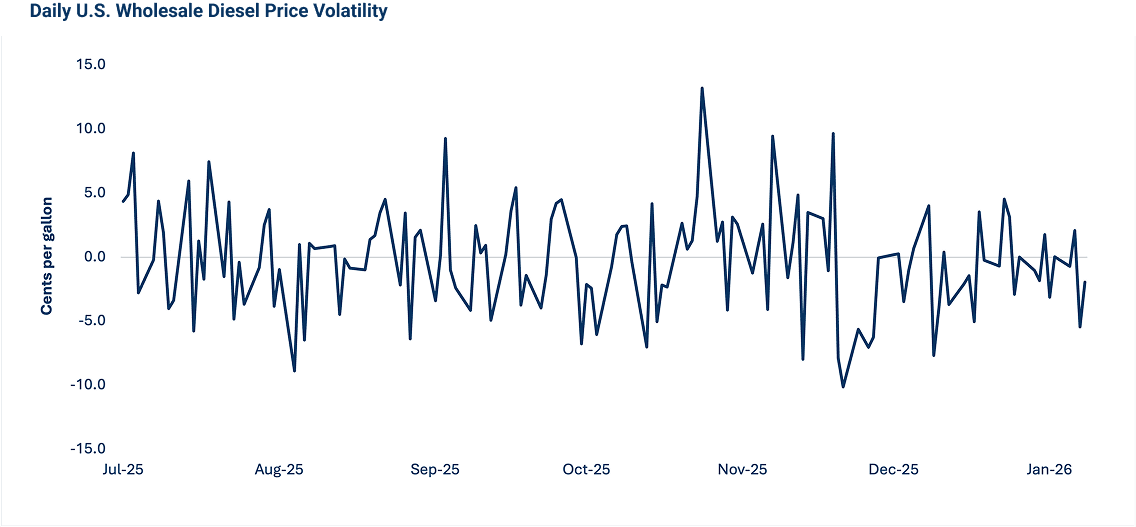
The chart above shows the magnitude of wholesale diesel market price changes that occurred between the DOE’s weekly retail diesel fuel price index.
A weekly index is fundamentally incapable of accounting for these daily fluctuations, and as a result, shippers are leaving large sums of money on the table. Shippers using a market-based fuel reimbursement program can create a competitive advantage in their supply chains by accounting for these daily fluctuations.
3. Tax
State over-the-road tax differentials can create discrepancies of more than 80¢ per gallon between different parts of the U.S. Carriers pay for taxes based on where they consume gallons, not where they purchase them. When shippers reimburse on a national level, the discrepancies missed at the lane level end up costing them extra.
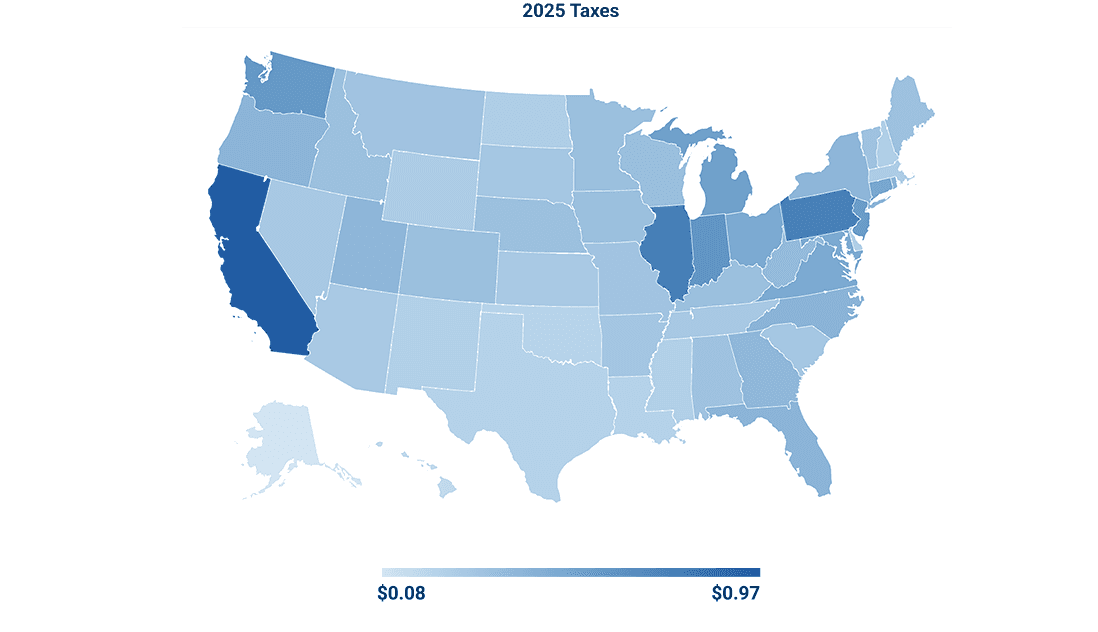
Tax values change each January and July as state laws are updated. The map above indicates the value of each state’s diesel tax in 2025, illustrating fuel prices are greatly influenced by tax rates across the country.
Shippers should pay the exact amount incurred by the movement of their goods. Taking a market-based approach accurately accounts for the state’s diesel tax for a fair fuel reimbursement.
4. Geography
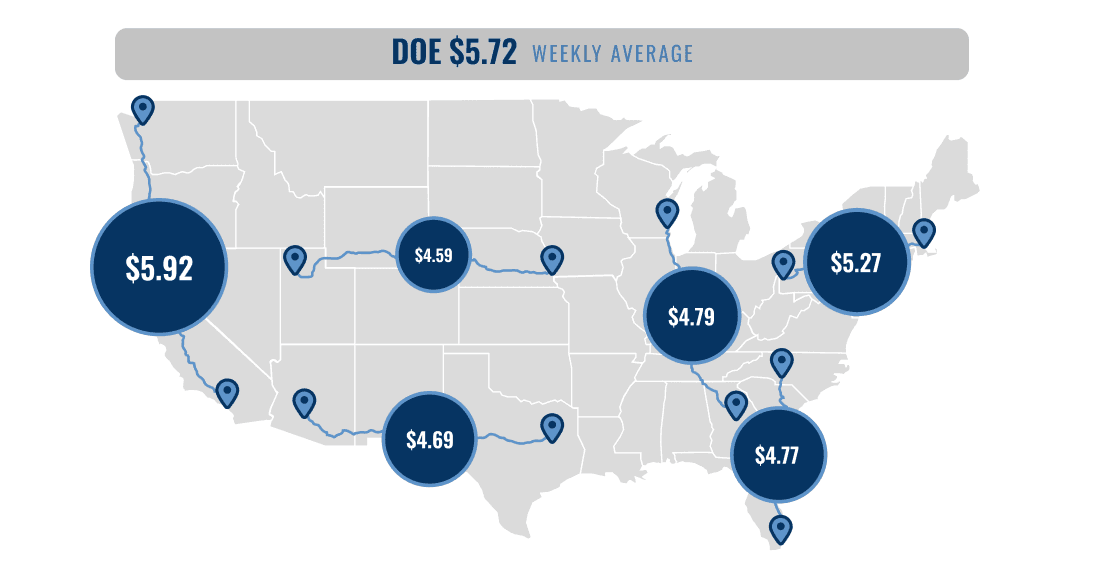
The price of diesel fuel varies across the country. The DOE Index’s one-time, weekly national average doesn’t reflect the reality of fuel procurement as diesel prices vary at every station along a route across the country. Even before taxes and final distribution costs are applied, diesel commodity costs can vary substantially from one location to the next.
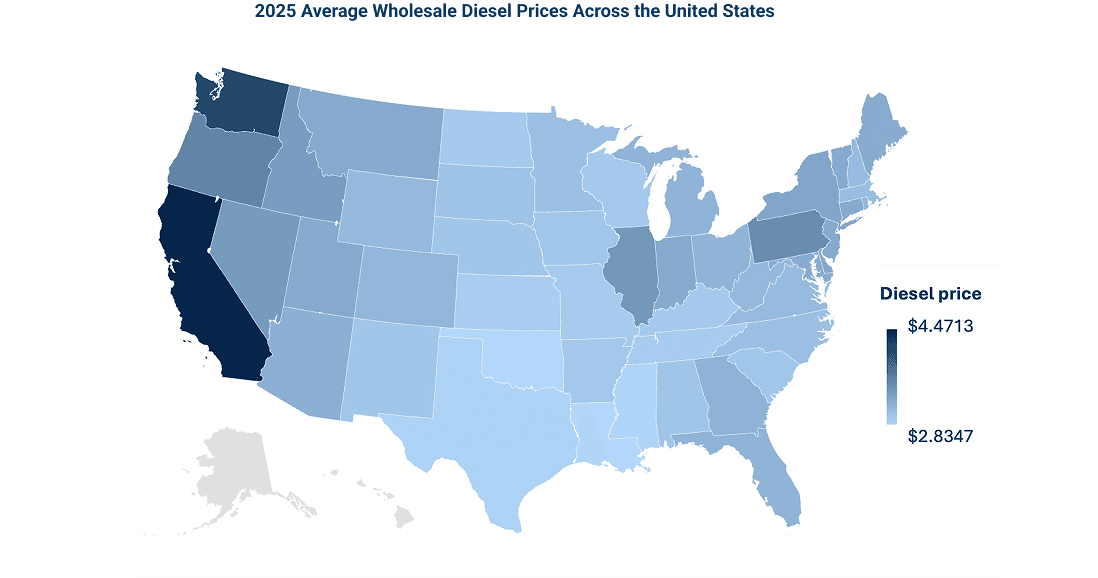
The chart above shows price differentials by state. Understanding the drivers and changes in local commodity prices is crucial to creating a reimbursement program that reflects the actual fuel cost incurred by carriers.
Common drivers of volatility include refinery maintenance mishaps and weather events. A shipper’s cost exposure also relies heavily on their geographic footprint. A market-based fuel reimbursement strategy accounts for the difference in pricing along a lane to remove the geographic distortion found in an index-based approach.
Discover the Value of a Market-Based Approach
A market-based approach has clear advantages over the distorted DOE Index that shippers have historically used to calculate a fuel surcharge. With Breakthrough’s Fuel Recovery solution, shippers can be confident they are paying the true cost of fuel on every movement, every day.
On average, shippers using Fuel Recovery achieved a 20% reduction in truckload fuel spend and 40% reduction in intermodal fuel spend. In 2025, the national average spread between retail and wholesale price points was 54.4 cents per gallon.
Fuel Recovery Clients Benefit From:
- Transparent Strategies: Get direct line-of-sight into fair-market fuel reimbursements based on actual movements to ensure both shippers and carriers are made whole.
- Reduced Costs: The accuracy created by market-based fuel reimbursements reduces transportation costs by 20% on average compared to shippers’ previous fuel programs.
- Accurate Reporting: Clear visibility to your network's true baseline fuel consumption creates a clear path to facilitate emissions reduction and network optimization initiatives.
Are you ready to move past averages and align your fuel strategy with reality?
Take the first step.

Download the e-book
Take the full Ditch the DOE e-book with you. Download your copy to save these insights for future reference or to share them with your team.
